Figure 1.
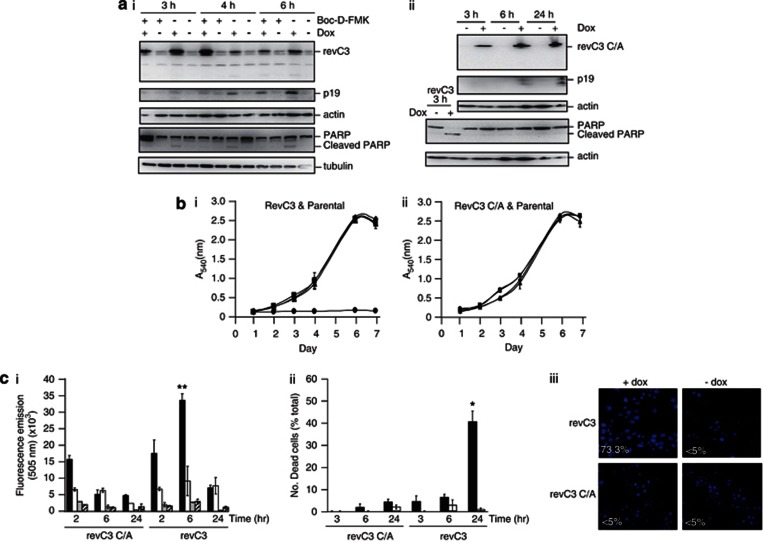
Validation of the death-switch in vitro. (a) Levels of revC3, endogenous cleaved caspase-3, p19 large subunit of cleaved caspase-3 and PARP in revC3-expressing ± Boc-D-FMK (1 mM) (i) or revC3 C/A (ii) cells ± dox, for 3, 4, 6 or 24 h. Lysates were probed for expression and processing as an indicator of apoptosis. Loading controls are actin and tubulin. Data shown are representative of three independent experiments. The large p19 subunit of caspase-3 (generated by cleavage of the pro-enzyme) is denoted by ‘p19'. (b) Cell population growth kinetics of revC3 and parental HT29 CCE9 cells (i) and revC3 C/A and parental HT29 CCE9 (ii) cells ± dox daily for 7 days. (i) RevC3+dox (•), revC3−dox (▪), HT29 CCE9+dox (▴), HT29 CCE9−dox (♦). (ii) revC3 C/A+dox ((•), revC3 C/A−dox (▪), HT29 CCE9+dox (▴), HT29 CCE9−dox (♦). Data shown are the mean of n=3±SD. (c) Kinetics of caspase-3 activity by fluorometric caspase-3 assay of revC3- and revC3 C/A-expressing cells ± dox, ±DEVD-CHO (i). (ii) Changes in cell viability in revC3- versus revC3 C/A-expressing cells ± dox. (iii) Nuclear morphology of revC3 and revC3 C/A cells ± dox for 6 h, % number of cells with apoptotic nuclear morphology. Solid black bars,+dox; open white bars,−dox; light grey bars,+dox,+DEVD-CHO; hashed bars,−dox,+DEVD-CHO. Data shown are mean of n=3±SEM. **P<0.001 versus C/A 6 h. *P<0.003 versus all other groups

