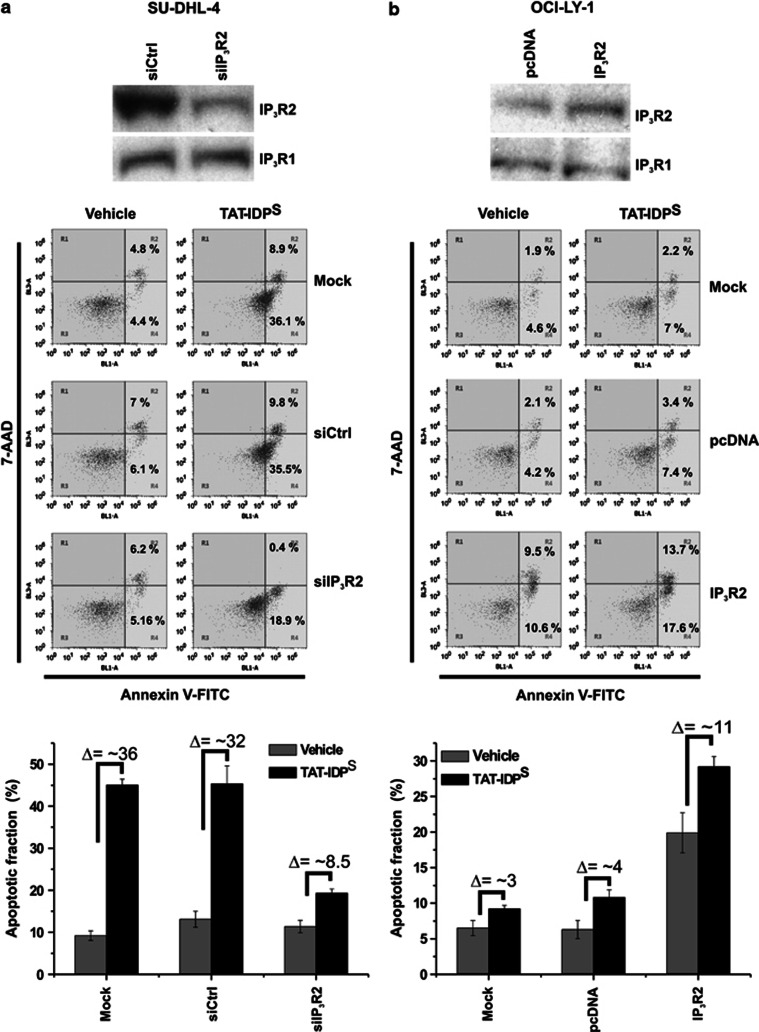
Figure 6.
Manipulation of IP3R2-expression levels in OCI-LY-1 and SU-DHL-4. (a) Western-blot analysis of IP3R2 and IP3R1 proteins in siCtrl- and siIP3R2-transfected SU-DHL-4 is shown in the upper panel. Representative dot plots from flow cytometry analysis of apoptosis induced by 2 h treatment without or with 10 μM TAT-IDPS in mock-, siCtrl-, and siIP3R2-transfected SU-DHL-4 are shown in the middle panel. Quantitative analysis of three independent experiments of the TAT-IDPS-induced apoptosis is shown in the bottom panel. (b) Western-blot analysis of IP3R2 and IP3R1 proteins in empty vector- and IP3R2 expressing plasmid-transfected OCI-LY-1 is shown in the upper panel. Representative dot plots from flow cytometry analysis of apoptosis induced by 2 h treatment without or with 10 μM TAT-IDPS in mock-, empty vector-, and IP3R2-expressing plasmid-transfected OCI-LY-1 cells are shown in the middle panel. Quantitative analysis of three independent experiments of the TAT-IDPS-induced apoptosis is shown in the bottom panel. Results are shown as average±S.D.

