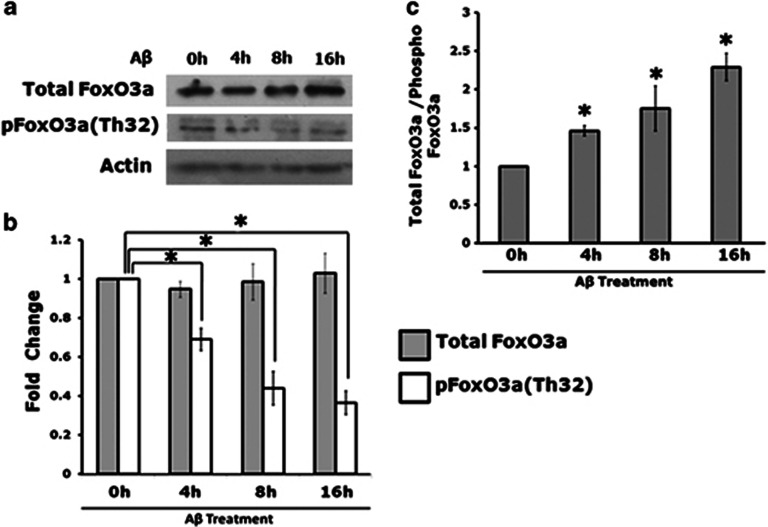
Figure 1.
Level of phosphorylation at Thr32 of FoxO3a is drastically reduced in response to Aβ. (a) Primary cortical neurons were exposed to oligomeric Aβ1-42 (1.5 μM) for indicated times. The total cell lysates were prepared as described in the experimental procedure and then proteins were separated by SDS-PAGE and probed by western blotting using enhanced chemiluminescence for the level of total FoxO3a and phosphorylated FoxO3a by using specific antibodies against FoxO3a and p-FoxO3a (Thr32). A representative immunoblot showing FoxO3a and p-FoxO3a levels is depicted. Actin level was used as loading control. (b) Graphical representation of the level of FoxO3a and p-FoxO3a as determined by scanning and quantification with NIH imageJ program. Data represent mean±S.E.M. of six independent experiments. *P<0.05. (c) Graphical representation of the ratio of total FoxO3a and p-FoxO3a protein level in cortical neurons exposed to Aβ. This ratio represents the level of active form of FoxO3a protein in the cell. Data are represented as mean±S.E.M. of six independent experiments. Asterisks denote statistically significant differences between 0 h (control) and 4, 8, 16 h of Aβ treatment: *P<0.001

