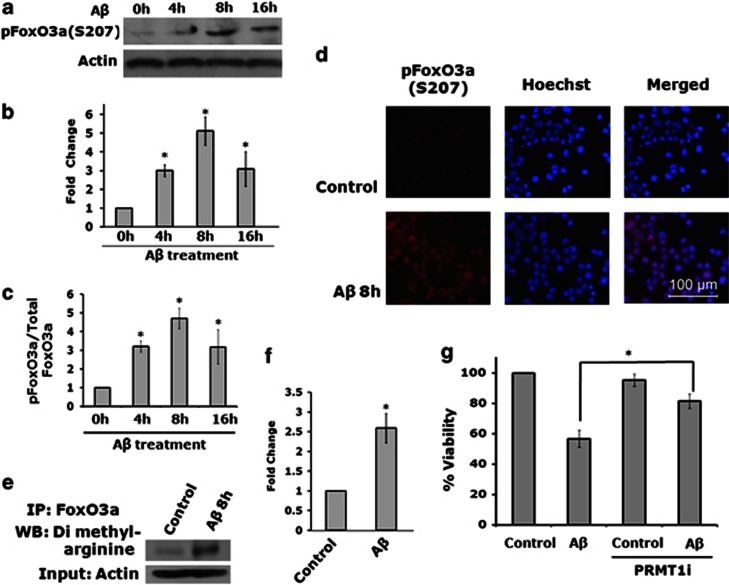
Figure 2.
MST1-mediated phosphorylation of FoxO3a at Ser207 and arginine methylation of FoxO3a increase on Aβ exposure. (a) Primary cortical neurons were exposed to oligomeric Aβ1-42 (1.5 μM) for the indicated times. The total cell lysates were separated by SDS-PAGE and subjected to western blotting using enhanced chemiluminescence. Specific antibody was used to detect the level of FoxO3a phosphorylated at serine 207. A representative immunoblot showing p-FoxO3a(S207) levels is depicted. Actin level was used as loading control. (b) Graphical representation of densitometric results of p-FoxO3a(S207) levels as determined by NIH imageJ program. Data are represented as mean±S.E.M. of three independent experiments. Asterisks denote statistically significant differences between 0 h (control) and 4, 8, 16 h of Aβ treatment: *P<0.01. (c) Graphical representation of ratio of PhosphoFoxO3a (S207) and total FoxO3a protein level in cortical neurons exposed to Aβ. This ratio represents the level of active form of FoxO3a protein in the cell. Data represented as mean±S.E.M. of three independent experiments. Asterisks denote statistically significant differences between 0 h (control) and 4, 8, 16 h of Aβ treatment: *P<0.001. (d) Differentiated PC12 cells were treated with Aβ1-42 (5 μM) for 8 h and immunostained with pFoxO3a(S207) antibody. Alexa Fluor 568 was used as secondary antibody. The nucleus was stained with Hoechst. Fluorescence microscope images show an increase in the level of pFoxO3a(S207) in cells exposed to Aβ1-42 (5 μM). (e) Methylation of FoxO3a at arginine residues in response to Aβ. Primary rat cortical neurons were treated with oligomeric Aβ1-42 (1.5 μM) for 8 h. The cell lysates were analysed for the level of FoxO3a methylated at the arginine residues. For this, total FoxO3a was immunoprecipitated using anti-FoxO3a antibody followed by western blotting by anti-dimethyl arginine antibody. A representative immunoblot showing increase in the arginine methylation of FoxO3a in Aβ1-42-treated cells is depicted. (f) Graphical representation of densitometric analysis of levels of FoxO3a methylated at arginine residues as determined by NIH imageJ program. Data are represented as mean±S.E.M. of three independent experiments. Asterisks denote statistically significant differences between control and treatment: *P<0.01. (g) Primary rat cortical neurons were treated with or without Aβ1-42 in the presence and absence of a chemical inhibitor of PRMT1. Quantitative data show significant protection of cells by the chemical inhibitor of PRMT1 against Aβ1-42-induced death. Data are represented as mean±S.E.M. of three independent experiments.*P<0.05

