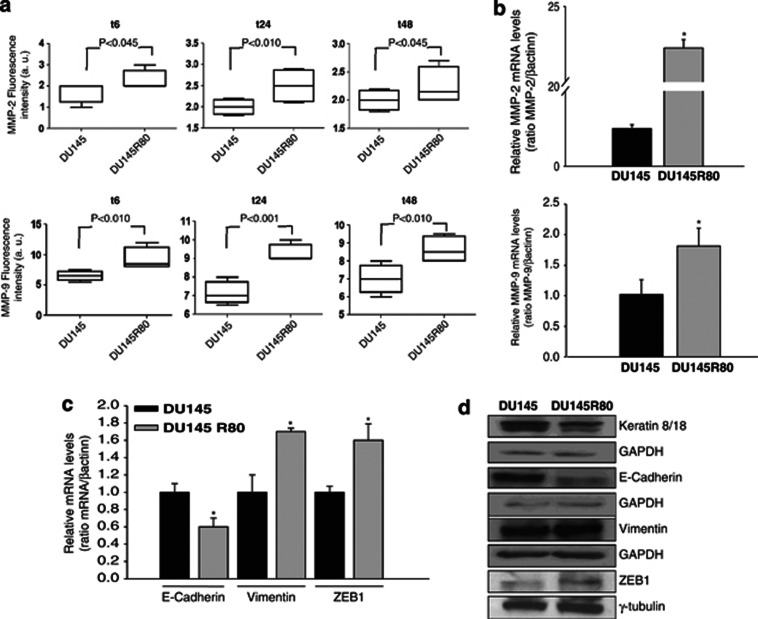
Figure 3.
Increased expression of MMPs and EMT features in DU145R80 compared with DU145 cells. (a) MMP-2 and MMP-9 concentrations were evaluated in the culture media from DU145 and DU145R80 cells at the indicated time points after seeding by a multiplex ELISA-based immunoassay assay, and were plotted with box-and-whisker graphs. The boxes extend from the 25th to the 75th percentile and the line in the middle is the median. The error bars extend down to the lowest value and up to the highest. (b) MMP-2 and MMP-9 mRNA expression was evaluated by RT-PCR after 24 and 6 h of cell culture, respectively. The data are representative of at least three independent experiments, include the means±S.D. of technical triplicates and reported statistical analysis of DU145R80 versus DU145 cells (*P<0.001, MMP-2; P=0.045, MMP-9). (c) E-cadherin, Vimentin and ZEB1 mRNA expression was evaluated by RT-PCR after 24 h of cell culture. The data are representative of at least three independent experiments, include the means±S.D. of technical triplicates and reported statistical analysis of DU145R80 versus DU145 cells (*P=0.02, E-cadherin; P=0.007, Vimentin; P=0.005, ZEB1). (d) Western blot analysis of Keratin 8/18, E-cadherin, Vimentin and ZEB1 proteins expression evaluated after 48 h of cell culture. GAPDH and γ-tubulin were used as protein loading control

