Figure 1.
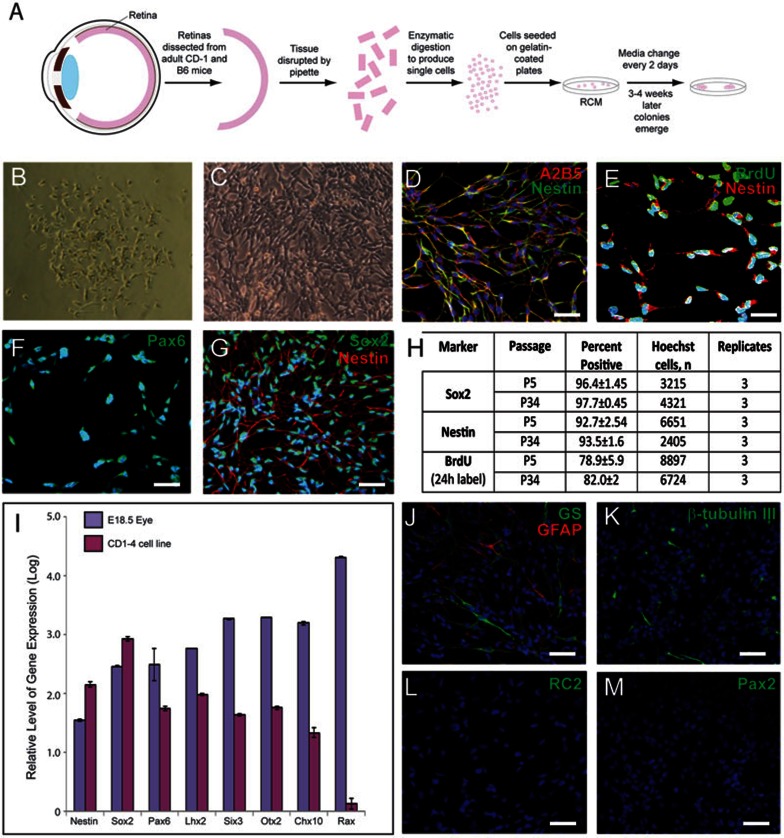
Retinal stem cells were isolated from adult retina. (A) Schematic representation of retinal stem cell isolation procedure. (B) Phase contrast imaging of a representative retinal stem cell colony. After 3-4 weeks of primary culture, very few spindle-shaped cells with smaller size could be found in the primary culture. (C) Phase contrast imaging of retinal stem cells cultured for 24 passages. (D–G) Retinal stem cells express high levels of retinal stem cell markers A2B5 (red) and Nestin (green) (D); Nestin (red) and BrdU (green) (E); Pax6 (F); Nestin (red) and Sox2 (green) (G). (H) Quantification of Sox2- and Nestin-positive immunostaining and BrdU incorporation at passages 5 and 34. (I) Retinal stem cells express mRNA transcripts of neural and retinal stem cell markers Nestin, Sox2, and Pax6, Lhx2, Six3, Otx2 and Chx10, and low levels of Rax. Gene expression levels were determined by quantitative RT-PCR analysis and values are presented as the log of the mean fold-increase over the expression observed in adult mouse fibroblasts (three replicates, ± SEM). Gene expression levels in embryonic E18.5 eye are provided as a comparison. Retinal stem cells express low levels of GS (green) and GFAP (red) (J), few express low levels of β-tubulin III (K), and all are negative for RC2 (L) and Pax2 (M). Scale bars, 50 μm (D, G–M) and 25 μm (E, F). Blue, DAPI.

