Figure 6.
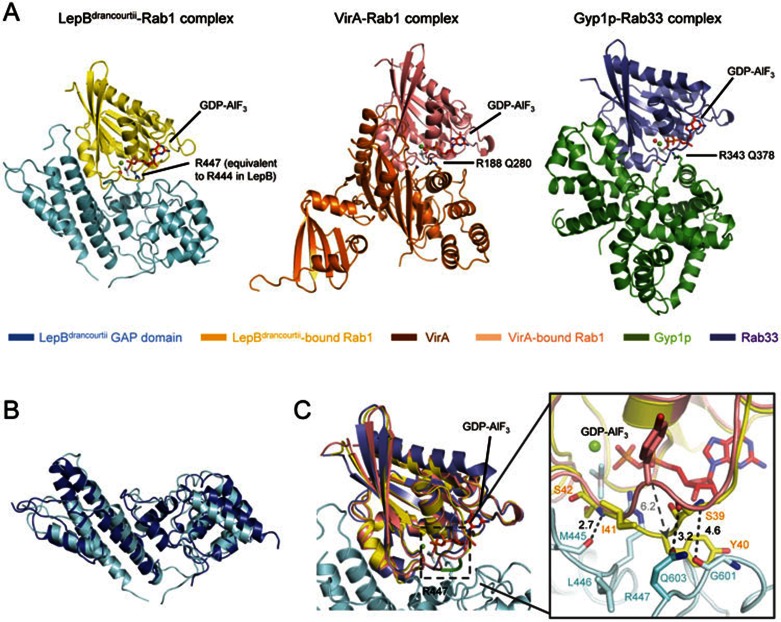
Crystal structure of LepBdrancourtii GAP domain-Rab1-GDP-AlF3 complex. (A) Overall structure of LepBdrancourtii GAP domain-Rab1-GDP-AlF3 complex in comparison with those of VirA-Rab1-GDP-AlF3 (PDB ID: 4FMB) and Gyp1p-Rab33-GDP-AlF3 complexes (PDB ID: 2G77). The overall structures are shown in cartoons with color scheme indicated underneath of the pictures. GDP and AlF3 in the complexes are shown in red stick models. Mg2+ and water are shown as green and red sphere, respectively. (B) Structural comparison of Rab1-bound LepBdrancourtii GAP domain (light cyan) with apo-LepB GAP domain (blue). The alignment was performed by using the two sets of Cα chains as the reference and the least-square algorithm. (C) Interactions of Rab1 with LepBdrancourtii GAP domain and structural comparison of Rab1 with Rabs in TBC and TBC-like RabGAPs. The superimposition was performed using Cα chains in Rabs as the references and the least-square algorithm. Left panel is the cartoon diagram of the superimposition. The color scheme follows that in A. The structurally rearranged loop in Rab1 is highlighted in green and boxed with black dashed line. Right panel is a close-up view of structural changes in Rab1. Residues involved in the interaction between Rab1 and LepBdrancourtii are shown in sticks colored as their residing chains. Polar interactions are depicted by black dashed lines with a number to denote the distance in angstrom. The drastic positional movement of Tyr40 in Rab1 is indicated by a dashed arrow.

