Figure 1.
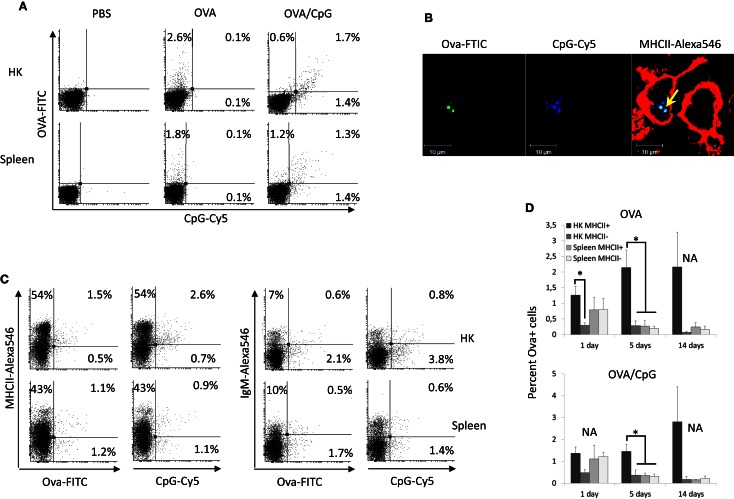
Fluorescent Ova-FITC and CpG-Cy5 ODNs injected in the abdominal cavity of Atlantic salmon accumulate predominately in HK MHCII+ cells. The fish were injected with Ova-FITC alone or in combination with CpG-Cy5 and their accumulation in head kidney (HK) and spleen leukocytes was analyzed with flow cytometry after 1, 5, and 14 days. The controls were injected with the same volume of PBS. (A) 24 h post injection approximately equal percentage of Ova+ and CpG+ cells was observed in HK and spleen and there was good correlation between the uptake of Ova and CpG ODNs. (B) HK cells from Ova/CpG-injected fish were stained for MHCII and were analyzed with confocal microscopy. The arrow indicates the colocalization between Ova and CpGs in endosomal compartments of MHCII+ cells. (C) Ova and CpG ODNs accumulate mostly in MHCII+/IgM− cells in HK. MHCII- and IgM-stained cells were analyzed with flow cytometry. The dot plots show the correlation between the surface expression of MHCII and IgM and the uptake of Ova and CpG ODNs in HK and spleen leukocytes isolated 24 h after injection. (D) The percentage of Ova+ cells in spleen declines sharply between 1 and 5 days post injection whereas in HK it remains high for up to 14 days. The histograms show the mean percentage of Ova+ cells in MHCII± cells in both the Ova and the Ova/CpG groups as determined by flow cytometry (n varies between 2 and 5), Statistical analysis was performed on samples taken on day 1 and day 5 since the number of replicates in all of these samples was >3, *P < 0.05.

