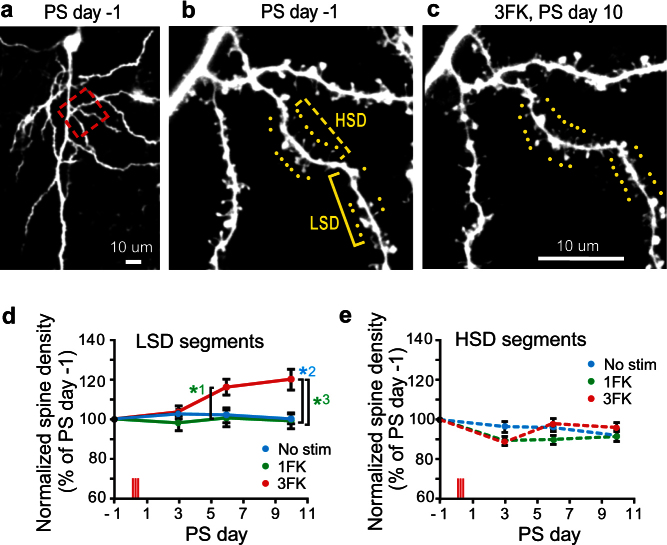
Figure 4. Spine density increase classified with respect to pre-existing spine density.
(a) Images (Z-stacked) of a representative cell viewed under a low power. (b, c) High power images of the boxed area in (a) obtained at PS day −1 and PS day 10. Brackets enclose examples of dendritc segments with high and low pre-existing spine densities (referred to as HSD and LSD, respectively). Yellow dots beside the segments indicate spines scored. (d, e) Average spine density changes in LSD and HSD dendritic segments. The numbers of LSD dendritic segments examined are 28, 23, and 31, for No stim, 1FK and 3FK specimens, respectively. The number of HSD segments examined are 16, 16 and 20, for No stim, 1FK and 3FK specimens, respectively. Statistic comparison was made by 2-way ANOVA followed by Bonferroni's test. P values are 0.043 for *1, 0.018 for *2 and 0.016 for *3.

