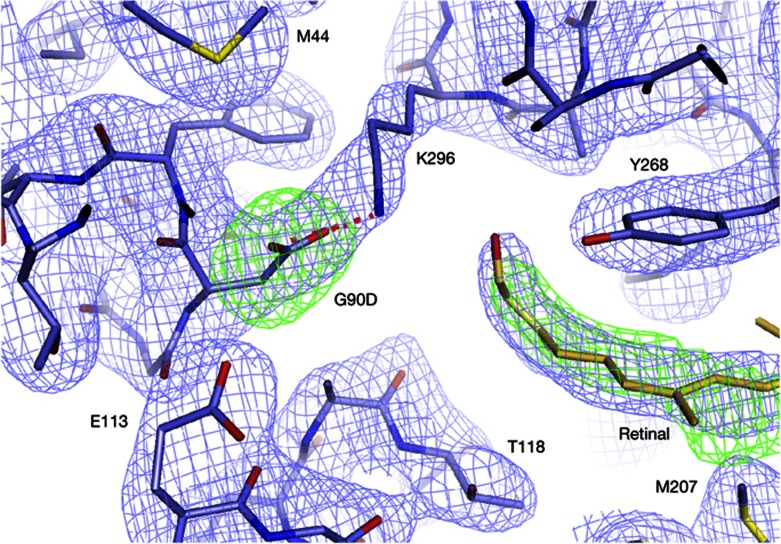
Figure 3.
Electron density (2Fo-Fc contoured at 1.5 sigma, blue and Fo-Fc contoured at 3.5 sigma, green) of the G90D-GαCT retinal-binding pocket calculated after simulated annealing refinement with the G90D side chain omitted. The obtained map shows a clear difference peak for the introduced G90D mutation and the salt bridge (red dashes) with K296. Clear positive density close to the position of all-trans-retinal in metarhodopsin-II indicates that some retinal was retained in the binding pocket during crystallization. Formation of the G90D-K296 salt bridge interferes with formation of a covalent bond and results in density that is most compatible with a mixture of retinals. For comparison, the 9,13-di-cis retinal isomer is shown as orange sticks.

