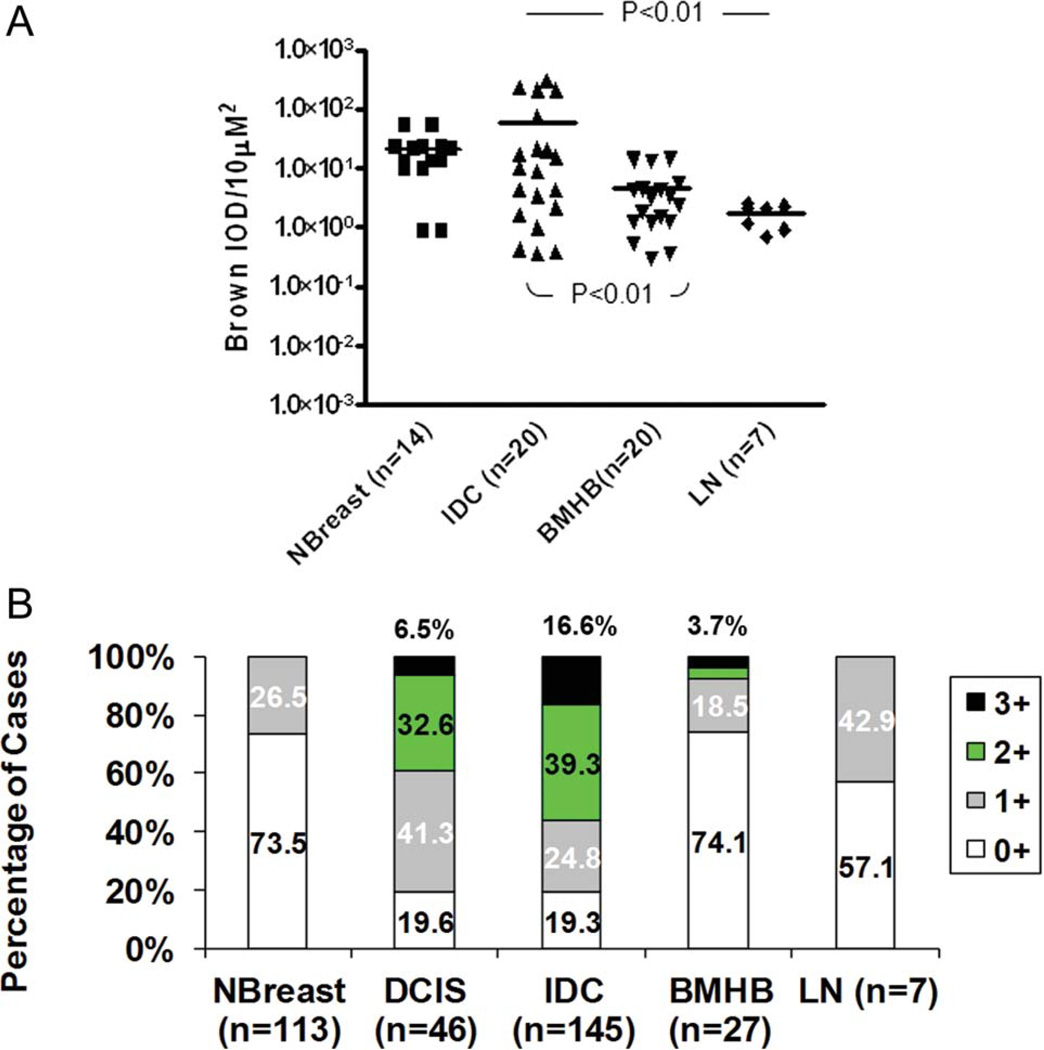
Figure 2.
The automated computer software (ACIS) score and immunohistochemistry (IHC) intensities of KISS1 stainings in tumor cells of patient samples. Evaluation of KISS1 immunoreactivity was assessed by ACIS (A) and intensities of cytoplasmic staining were calculated manually in each core at magnification (200×) by pathologists and plotted as percentage of cases having mild (1+), moderate (2+), and strong (3+) intensities of expression or no expression (0) (B). Statistical analyses for ACIS score, conducted by using Kruskal-Wallis test, indicated a significant difference in expression of KISS1 among BMHB, IDC, DCIS, NBreast, and LN samples (P = .014). Dunn multiple comparison test (2 sided) was applied to determine the difference between groups. P values <.05 were observed between IDC samples and LN along with difference between IDC and intracerebral metastases (BMHB). In the validation set (B), statistical significance between IDC, NBreast, BMHB, and LN samples was revealed by using the Fisher test (P < .001). The pairwise comparison Fisher exact test: IDC versus DCIS, P = .11; IDC versus BMHB, P < .001; IDC versus NBreast, P < .001; IDC versus LN, P = 013.

