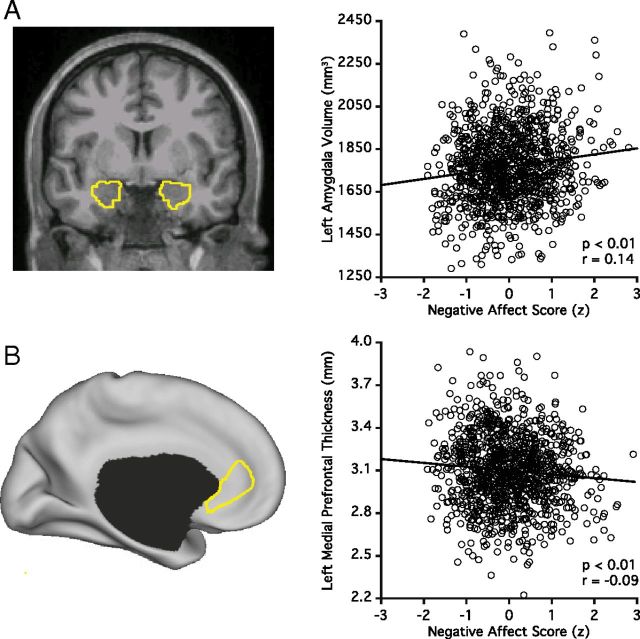
Figure 2.
Amygdala and medial prefrontal cortex are associated with negative affect. A, Representative segmentations of the left amygdala and right amygdala. The scatter plot displays the correlation between trait negative affect and left amygdala volume. B, The targeted medial prefrontal subregion defined using FreeSurfer is displayed. The region includes portions of the left rostral anterior cingulate cortex and the subgenual anterior cingulate cortex (see Materials and Methods, Statistical analysis). Map effects do not limit exploration to the medial prefrontal cortex but also converged on the same general region, reinforcing that it was appropriate to target this subregion for hypothesis-driven analyses. The scatter plot is displayed as in A.

