
Figure 4.
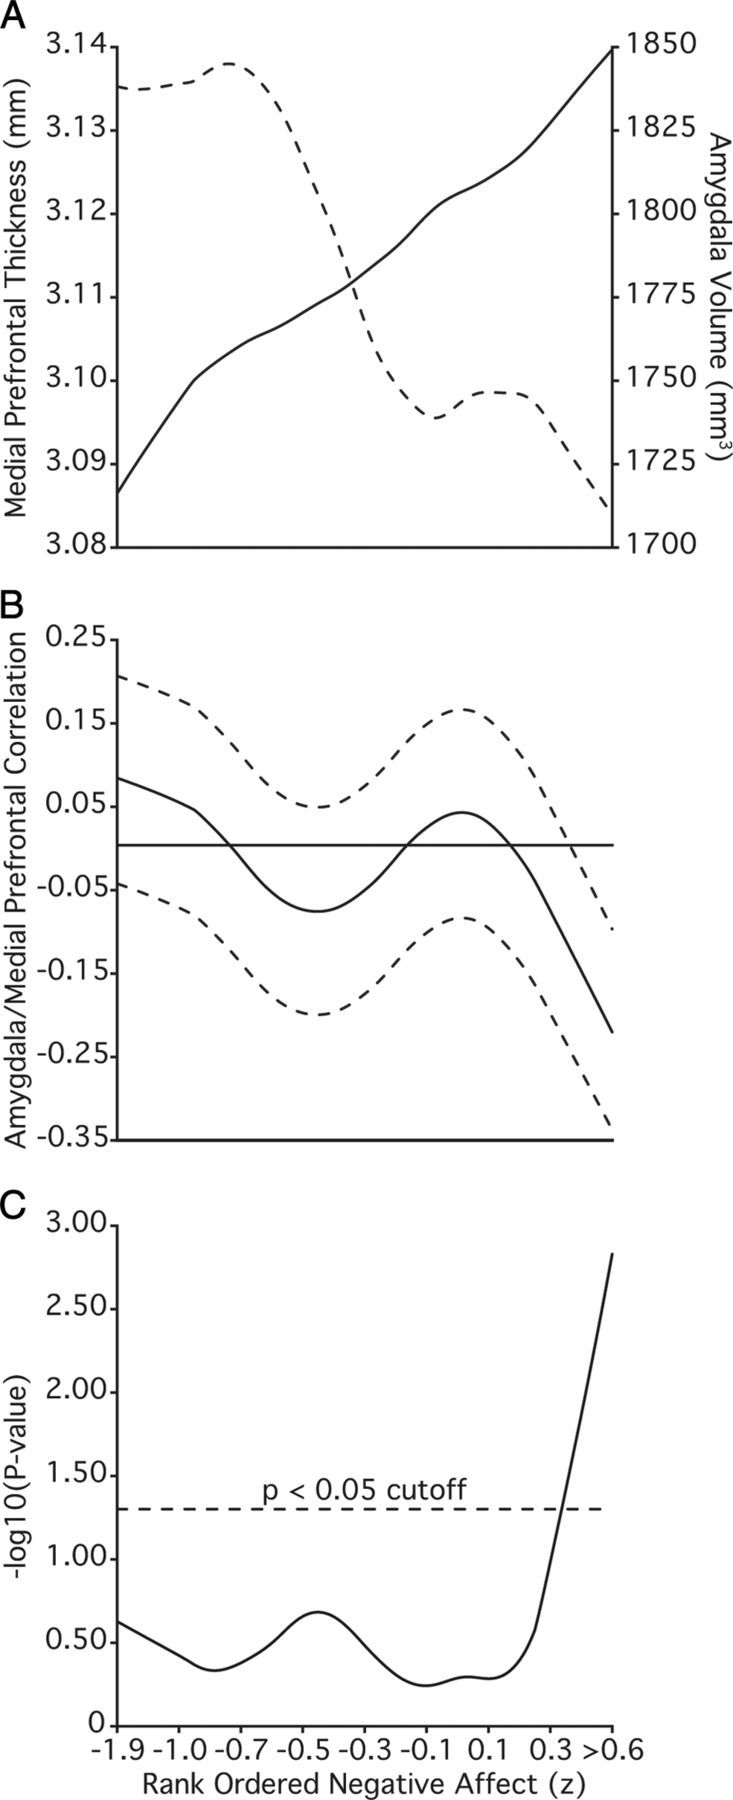
Rank ordering of individuals by negative affect reveals an inverse correlation between amygdala volume and medial prefrontal thickness. Data rank ordered by negative affect, averaged (n − n + 249), and smoothed with a lowess filter (span = 250). Reported values are after partialing out the variance associated intracranial volume from the left amygdala as well as collection site, scanner software, estimated IQ, age, and sex from both structures. A, Rolling average of left amygdala volume (solid line) and left medial prefrontal thickness (dotted line). B, Rolling Pearson correlation between amygdala volume and medial prefrontal thickness. Dotted lines reflect 95% confidence interval. C, Resulting p values (−log10). Individuals reporting the most severe symptoms show the strongest negative correlation between the amygdala and the medial prefrontal thickness.