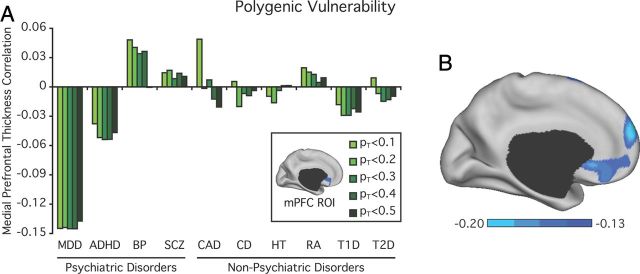
Figure 8.
Heightened polygenic depression risk is associated with reduced mPFC thickness in clinically healthy individuals. A, Variance in cortical thickness explained on the basis of scores derived from four psychiatric and six nonpsychiatric illnesses across varying significance thresholds (PT < 0.1, 0.2, 0.3, 0.4 and 0.5, plotted left to right). BP, Bipolar Disorder; SCZ, Schizophrenia; CAD, coronary artery disease; CD, Crohn's disease; HT, hypertension; RA, rheumatoid arthritis; T1D, type I diabetes; T2D, type II diabetes. The selected mPFC region is displayed in the figure legend. Reported r values are after partialing out variance associated with collection site, scanner software, estimated IQ, multidimensional scaling components of genetic ancestry, number of nonmissing SNPs, age, and sex. Equivalent variance is explained across the MDD polygenic scores (Z < 0.12, p > 0.91). No other psychiatric or nonpsychiatric polygenic scores approached significance (p > 0.59). B, Surface-based rendering reflects the strength of the correlation between each vertex and polygenic risk for MDD (PT < 0.5) after partialing out the variance associated with the collection site, scanner software, estimated IQ, potential for population substratification, number of nonmissing SNPs, age, and sex. Display threshold is set at p < 0.01 uncorrected for multiple comparisons. Color bar reflects Pearson correlations.

