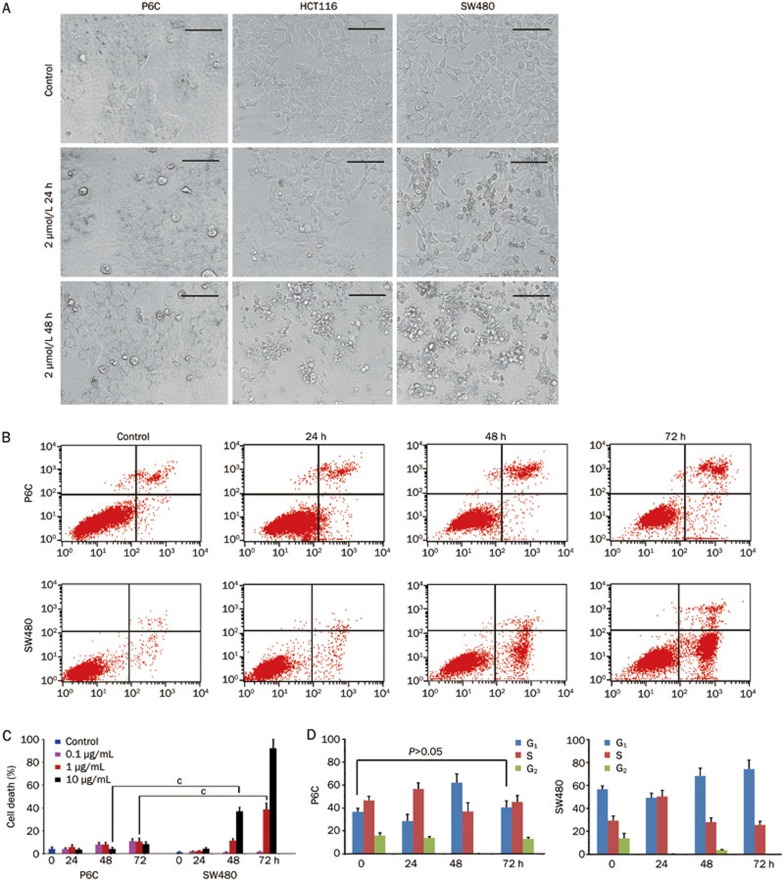
Figure 6.
Chemoresistance of the P6C cells. (A) Morphological observation of P6C, HCT116 and SW480 cells treated with 2 μmol/L camptothecin. Cell morphology was observed under a microscope at 24 and 48 h. Scale bars, 100 μm. (B) 5-FU induced cell death of P6C and SW480 cells. Cells were treated with 1 μg/mL 5-FU for the indicated times and were then trypsinized. After staining with Annexin V and PI, flow cytometric analysis was performed. (C) Statistical analysis of 5-FU induced cell death. P6C and SW480 cells were treated with 0.1, 1, and 10 μg/mL 5-FU for the indicated times. Cell death was calculated as the percentage of PI+ cells, as determined by flow cytometry. This experiment was repeated 3 times. cP<0.01. (D) Cell cycle analysis of P6C cells treated with 5-FU. The DNA content of the indicated cells was detected by PI staining followed by flow cytometric analysis. Each sample was performed in triplicate, and the experiment was repeated 3 times.

