
Figure 1.
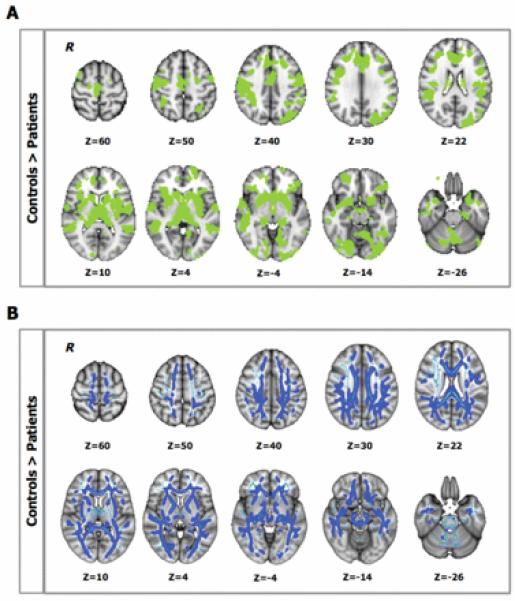
A. Between-group differences in gray-matter (GM) volume (P < .05, corrected): patients showed lower GM volume than controls in the highlighted (green) regions. B. Between-group differences in white matter (WM) fractional anisotropy (FA; P < .05, corrected): light blue defines the WM “skeleton” in which the group-based statistical contrast was carried out and superimposed; dark blue indicates regions where patients show lower FA than controls. R identifies the right hemisphere.