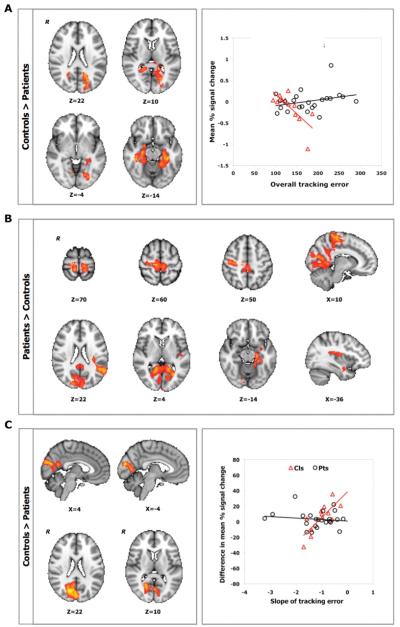
Figure 4.
A. Relationship between individual variation in overall tracking error at baseline and BOLD percentage signal change during fMRI1 (Z > 2.3, P < .05, corrected) for controls (triangle) and patients (circle). B. Relationship between individual variation in the rate of short-term practice-related improvements and brain activation for sequence versus rest during fMRI1 (Z > 2.3, P < .05, corrected). C. Relationship between individual variation in longer-term practice-related improvements and difference between sessions (fMRI1 vs fMRI2) in percentage signal change for the sequence versus rest contrast (Z > 2.3, P < .05, corrected) for controls (triangle) and patients (circle). Results are controlled for initial performance (day 1). R identifies the right hemisphere.

