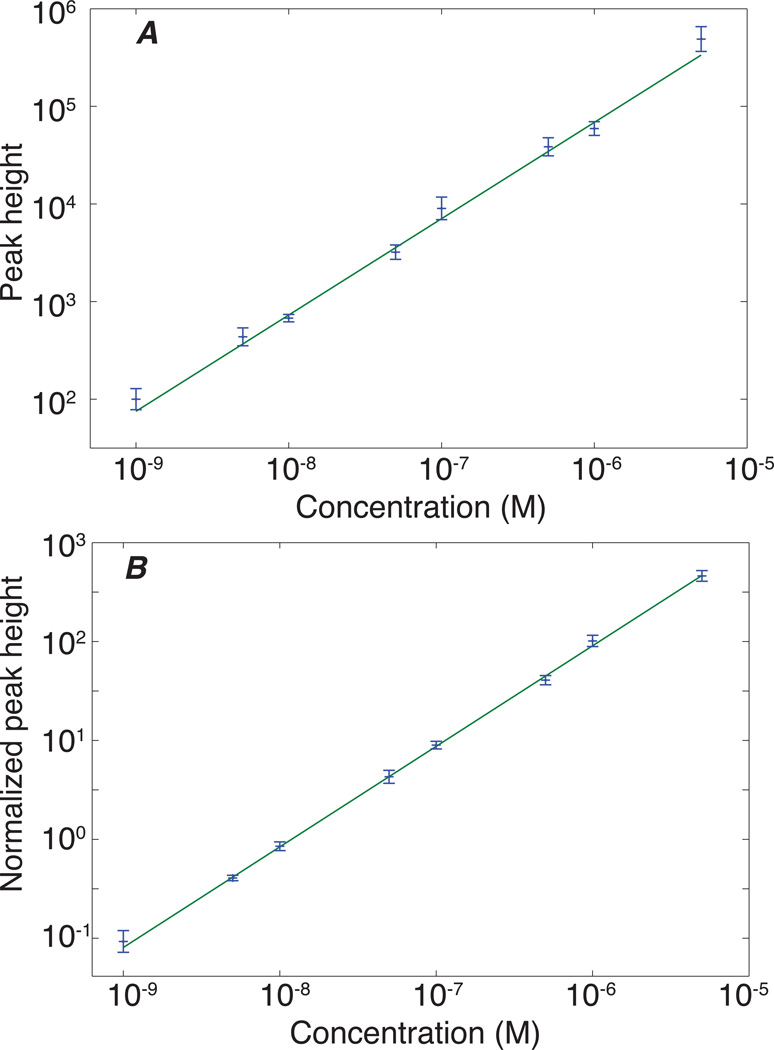
Figure 1.
Log-log calibration curve for Lue enkephalin in 66 nM BSA digest for the 556.2 → 397.1 transition. Propagation of errors was used to estimate the uncertainty in the log(signal). The line is the result of a linear least squares fit of a first order polynomial to the data. The slope of the line and the reduced chi-squared for the fit are included in Table 1. A – raw data. B – normalized to the 569.75→ 818.44 transition from a BSA peptide, which corrects for variations in injection volume.

