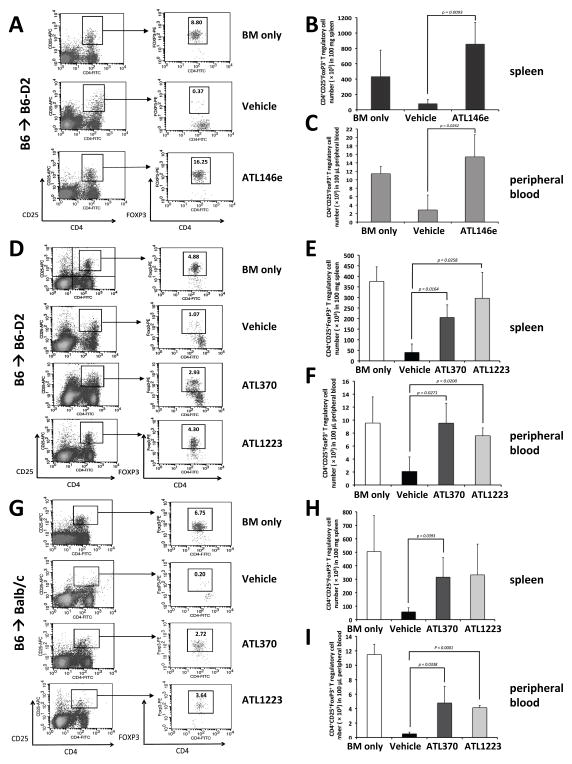
Figure 4. A2AR agonists increase T regulatory cells in acute GVHD mouse models.
The percentages or number of CD4, CD25, FoxP3 positive cells in various tissues post transplant are shown. Panel (A): data from a representative experiment using the B6-D2 into B6 model. Panels (B) and (C): cumulative number of CD4, CD25, FoxP3 positive cells data from 3 experiments analyzing 100 mg of spleen and 100 μl of peripheral blood respectively. Panel (D): data from a representative experiment using the same model but treated with either ATL370 or ATL1223. Panels (E) and (F): cumulative data from 3 independent experiments for both agonists. Data from the B6 into Balb/C recipients is shown in Panels G, H and I where G is the data from one representative experiment and Panels H and I, the cumulative data for spleen and peripheral blood from 3 separate experiments. For all experiments, P values were calculated comparing vehicle control to drug using student’s t test.

