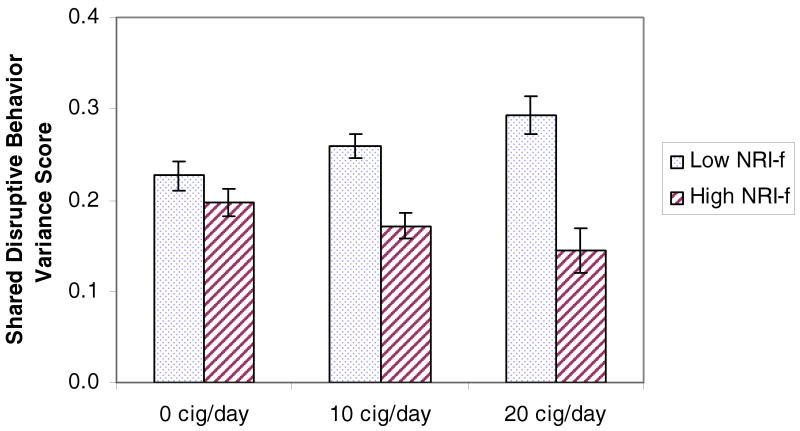
Figure 2. Interaction of Exposure & Paternal Responsive Engagement in Prediction of Shared Disruptive Behavior Variance.
a For illustrative purposes, low paternal responsive engagement is graphed at 1 SD below the mean and high paternal responsive engagement is graphed at 1 SD above the mean.
bThe minimum possible average estimate of disruptive behavior score is 0, and the maximum possible score is 1.
c At low levels of paternal responsive engagement, there were significant differences between average estimates of disruptive behavior for non-exposed youth vs. moderately and heavily exposed youth (10 cig/day vs 0 cig/day and 20 cig/day vs 0 cig/day) (p < .05). Comparisons across these exposure groups were not significant at high levels of paternal responsive engagement.

