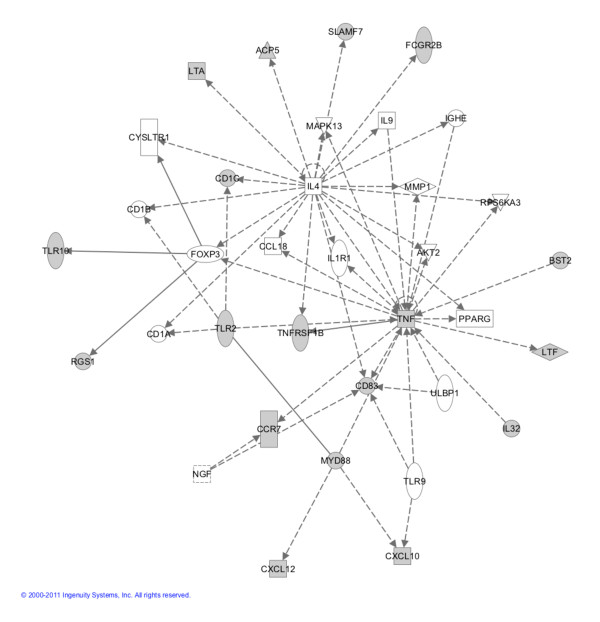
Figure 4.
Ingenuity Pathway Analysis software network plot. Genes shaded grey were part of the magenta module and are significantly altered in the parotid gland of primary Sjögren's syndrome patients. Test statistics and P values of individual genes can be found in Additional file 3 (humans) and Additional file 4 (mouse).

