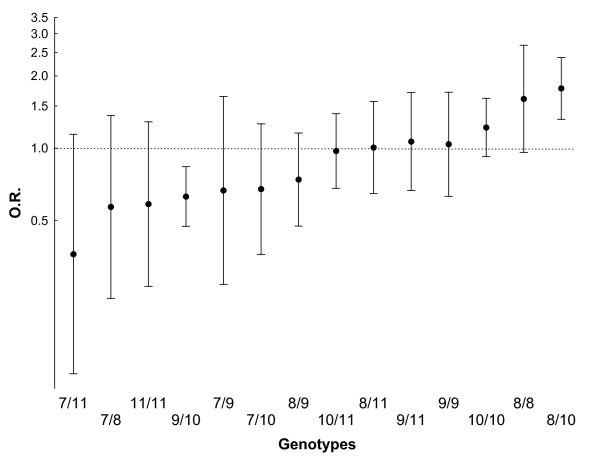
Figure 1.
Comparison of the individual genotypes between women with knee osteoarthritis (OA) and controls. The odds ratio (OR) and 95% CI corresponding to the specified genotypes relative to the remaining are represented for frequencies in patients in relation to controls. The order is from protective to risk genotype.

