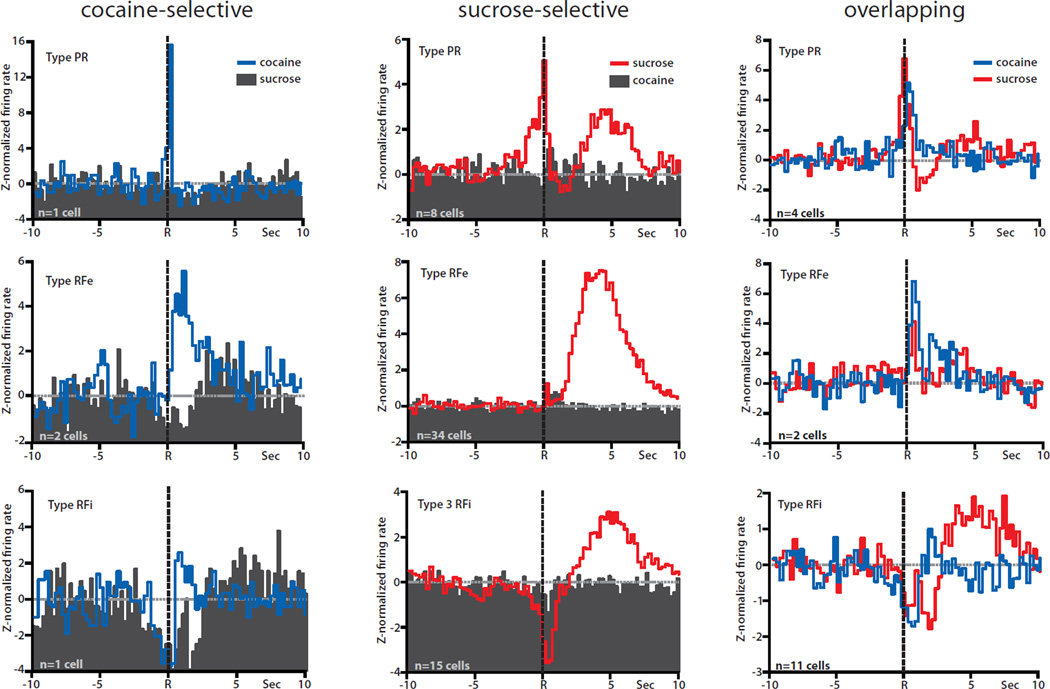
Fig. 3.
Population histograms of the three cell classifications (cocaine-selective, sucrose-selective, and overlapping) recorded prior to abstinence (Day 1), separated by type of phasic activity (PR, RFe, or RFi). Lever press responses are indicated by the dashed black line at time R in all PEHs. Averages were z-normalized, and the baseline is indicated by the dashed gray line at 0. Left column: population averages of cocaine-selective cells. The activity of the same neurons relative to cocaine responding (blue lines) vs. sucrose responding (filled histograms) plotted on the same graph. Normalized firing displayed one of the three well-defined patterns of phasic activity (PR, top; RFe, middle; RFi, bottom) relative to cocaine-reinforced responses but the same cells showed no change from baseline relative to sucrose-reinforced responses. Middle column: population averages of sucrose-selective cells. Normalized firing displayed one of the three patterns of phasic activity (PR, top; RFe, middle; RFi, bottom) relative to sucrose-reinforced responses (red lines), but no change from baseline relative to cocaine-reinforced responses (filled histograms). Right column: population averages of overlapping cells. Normalized firing displayed the same types of phasic activity (PR, top; RFe, middle; RFi, bottom) relative to both cocaine-reinforced (blue lines) and sucrose-reinforced (red lines) responses.

