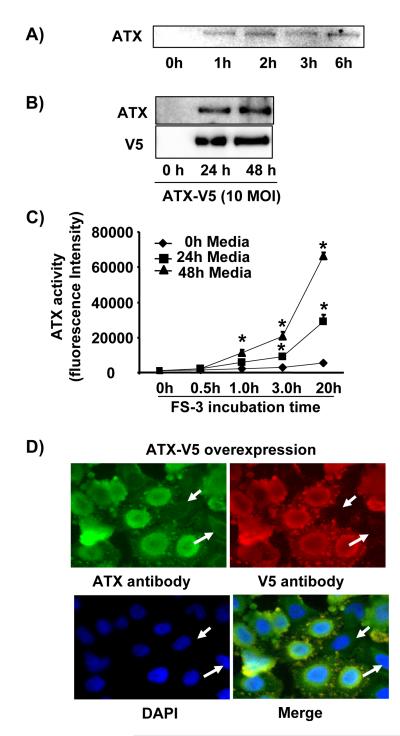
Figure 1. A549 cells release ATX.
A) Serum free-culture medium was collected after incubation of cells for 1-6 h, and the presence of ATX was determined by immunoblotting with an anti-ATX antibody. Shown is a representative blot from three independent experiments. B) A549 cells were infected with ATX-V5 adenovirus (10 MOI) for 24 h and 48 h. ATX-V5 present in culture supernatant was determined by imunoblotting using antibodies against ATX and V5. Shown are representative blots from three independent experiments. C) Conditional medium from above was incubated with FS-3 for indicated times (0 - 20 h) and fluorescence was measured. The graph represents ATX activity (mean ± S.D.) from three independent experiments. *p<0.01, compared to control medium. D) Cells were infected with ATX-V5 (10 MOI, 24 h), and immunostained with antibodies against ATX and V5 tag. Shown are representative images from three independent experiments.

