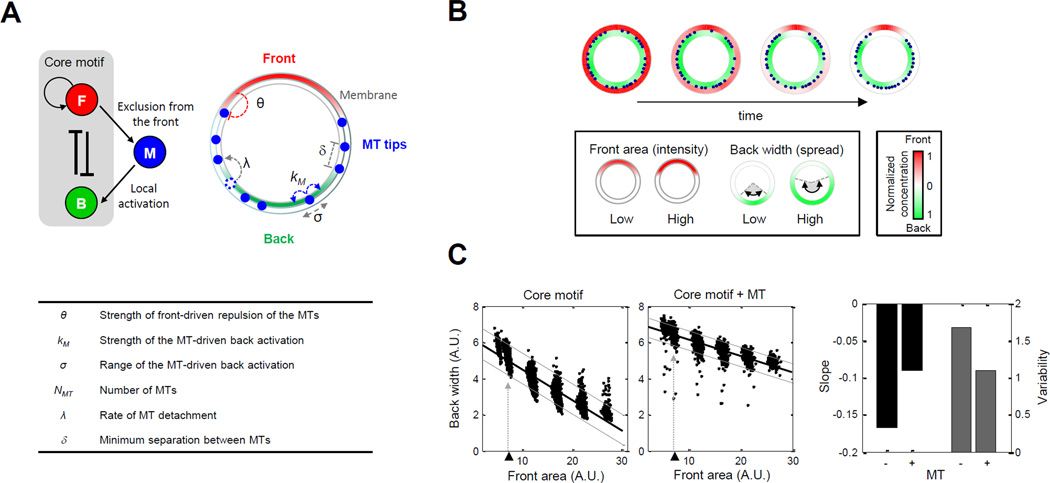
Figure 3. Mathematical model of microtubule interactions with front and back reveals a role for buffering back polarity.
A. Illustration of the neutrophil polarity model featuring interactions among front (red), back (green) and microtubules (blue). (Top left) Two additional interactions were added to the “core” motif accounting for the exclusion of microtubules from the front and microtubule-mediated activation of the back. (Top right and table) Parameters used to model microtubule-mediated front-to-back interaction (Supplemental Information). See also Figure S4A and Table S2. B. Sample outcome of polarization from simulated model. Cell membrane is visualized with an annulus; blue dots represent the location of microtubule tips on the membrane. Red/green color map: spatial distribution of active front/back components. For visualization, the maximum values of front and back concentrations are both normalized to one. For each polarized cell, the front area and back width were measured as proxies of the front intensity and back spreadness (Supplemental Information). C. Scatter plots of back width versus front area obtained by sampling parameters. Top left/middle panels: without/with microtubules. Thick black lines: regression lines. Lower and upper gray lines: spreadness around regression line (Supplemental Information). Triangles and dotted lines refer to data points obtained by varying the front amount around its nominal value. Bar graph: regression slope and variability of back width versus front area.

