Figure 5.
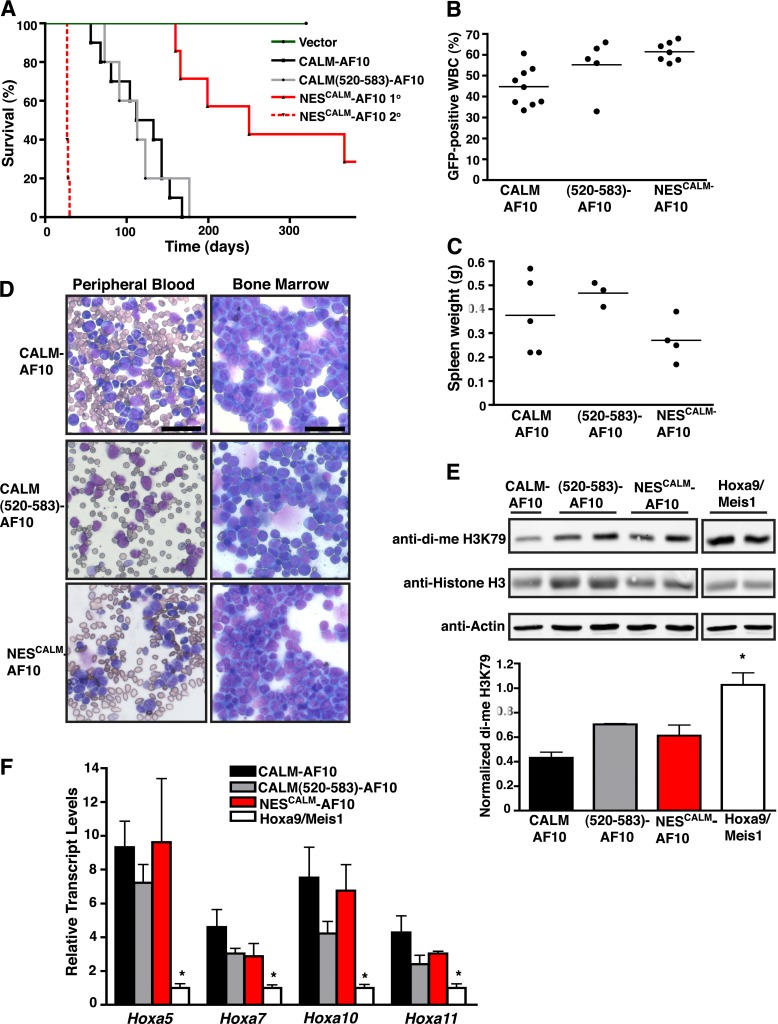
CALM(520-583)-AF10 and NESCALM-AF10 are sufficient to induce leukemias in vivo with characteristics similar to CALM-AF10 leukemias. (A) Kaplan-Meier survival curve of mice transplanted with empty vector (n = 4), CALM-AF10 (n = 10), CALM(520-583)-AF10 (n = 5), or NESCALM-AF10 (n = 7) transduced bone marrow cells. All vector-transduced mice remained leukemia-free through the course of the study and were sacrificed at 320 d posttransplantation. The survival curve of secondary transplant mice (n = 5) injected with NESCALM-AF10 primary leukemias (2 primary leukemias injected to 2 or 3 mice) is depicted by a dashed red line. (B) Percentage of GFP-positive white blood cells (WBC) in the peripheral blood of mice measured at 27 d (CALM-AF10), 25 d [CALM(520-583)-AF10], or 24 d (NESCALM-AF10) posttransplantation. (C) Spleen weights from mice with CALM-AF10, CALM(520-583)-AF10, and NESCALM-AF10 leukemias measured at time of death. A normal murine spleen weighs approximately 0.09 g. (D) Representative peripheral blood and bone marrow smears from mice with CALM-AF10, CALM(520-583)-AF10, and NESCALM-AF10 leukemias. Bars represent 40 μm for all panels. (E) Representative western blots of di-me H3K79, histone H3, and Actin protein levels in separate CALM-AF10 (shown is 1 sample of 3), CALM(520-583)-AF10 (shown are 2 samples of 3), NESCALM-AF10 (shown are 2 samples of 3), and Hoxa9/Meis1 (shown are 2 samples of 3) leukemias. Quantification data represent the mean ± SEM of di-me H3K79 values normalized to histone H3 from separate leukemias (n = 3 for each). Statistical analysis was performed by one-way ANOVA followed by Dunnett’s multiple comparison test. Only Hoxa9/Meis1 was found to be statistically different from CALM-AF10: *P < .05. (F) Hoxa transcript levels were obtained by real-time RT-PCR and normalized to housekeeping genes GAPDH and β2M and then to Hoxa9/Meis1 leukemic cells by the ΔΔCt method. Results are shown as mean ± SEM compiled from 3 CALM(520-583)-AF10, 3 NESCALM-AF10, 4 CALM-AF10, or 4 Hoxa9/Meis1 separate leukemias. Statistical analysis was performed by one-way ANOVA for each Hoxa gene followed by Dunnett’s multiple comparison test. Only Hoxa9/Meis1 was found to be statistically different from CALM-AF10: *P < .05.

