Figure 6.
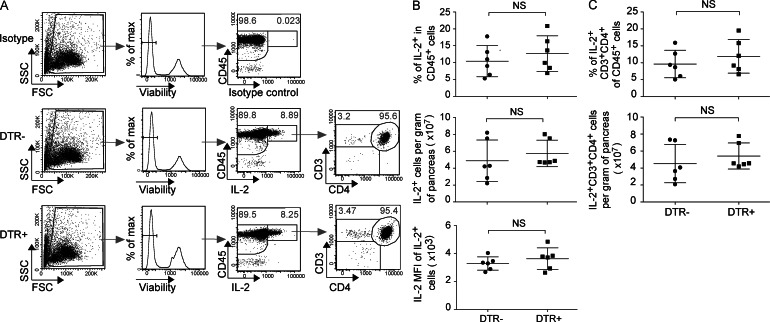
IL-2 production in the pancreas before and after T reg ablation. (A) Representative flow cytometry plots for pancreatic infiltrate from BDC2.5/NOD mice stained and analyzed for IL-2 by intracellular flow cytometry. An extended FSC/SSC gate was taken to include both lymphocytes and leukocytes along with a live/dead stain to exclude dead cells. CD45+IL-2+ cells were analyzed for CD3 and CD4 expression. (B) Summary data for pancreatic infiltrate from mice depleted of T reg cells (8 h with DT, DTR+) or not (8 h with DT, DTR−). Mean ± SD, at least three independent experiments. (C) Summary data, as in B, gated on CD4+ T cells.

