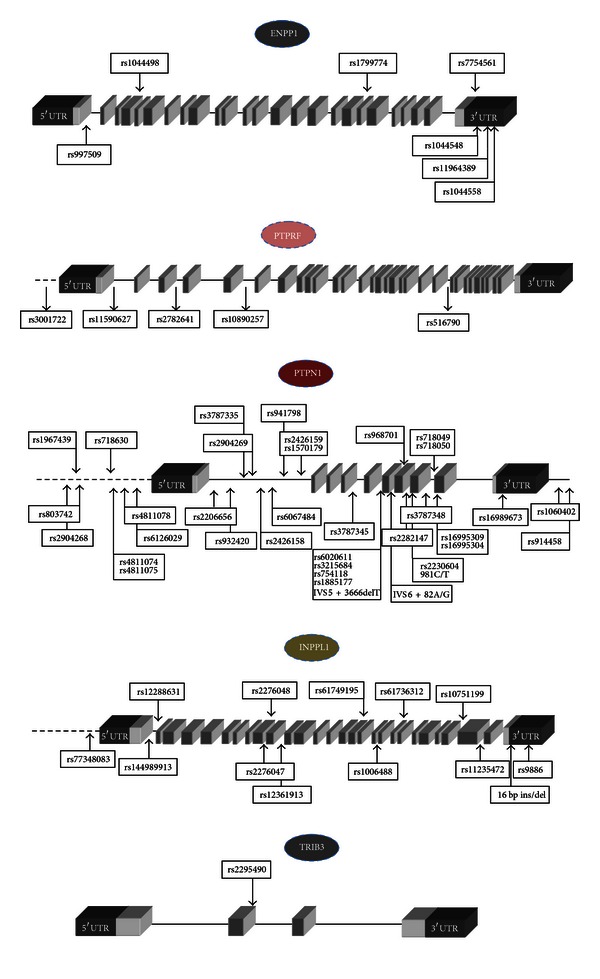
Figure 2.

Genomic structure of insulin-signaling inhibitor molecules with selected single nucleotide polymorphisms (SNPs). Disease-associated SNPs are reported in boxes. Dark grey blocks = 5′ and 3′UTR regions; light gray blocks = exons; dotted lines-promoter regions.
