
Figure 11.
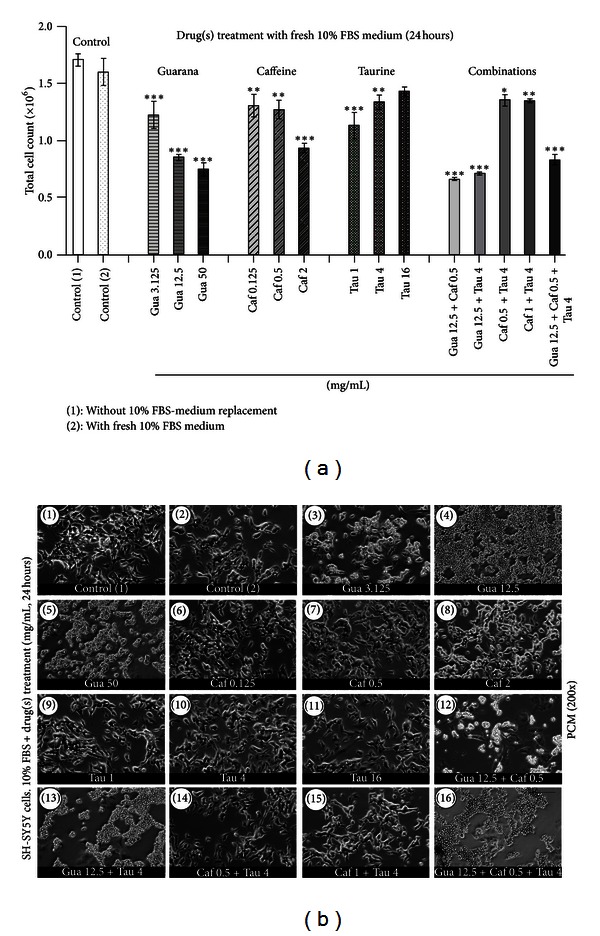
Analysis of drug-induced long-term effects on cell number. (a) Flow cytometric analysis (FC) of the total number of human neuronal SH-SY5Y cells after treatments with guarana (3.125, 12.5, and 50 mg/mL), caffeine (0.125, 0.5, and 2 mg/mL), taurine (1, 4, and 16 mg/mL), and their combinations for 24 hours in 10% FBS-containing culture medium. Values are expressed as mean ± SEM of three independent experiments (n = 3). Statistical difference compared to control (1) was determined by one-way ANOVA followed by Dunnett's multiple comparison test (*P < 0.05; **P < 0.01; ***P < 0.001). (b) Phase contrast microscopy (PCM) of human neuronal SH-SY5Y cells after treatments with different concentrations of guarana (3.125, 12.5, and 50 mg/mL), caffeine (0.125, 0.5, and 2 mg/mL), taurine (1, 4, and 16 mg/mL), and their combinations for 24 hours in 10% FBS-containing culture medium. Scale bar represents 30 μm.