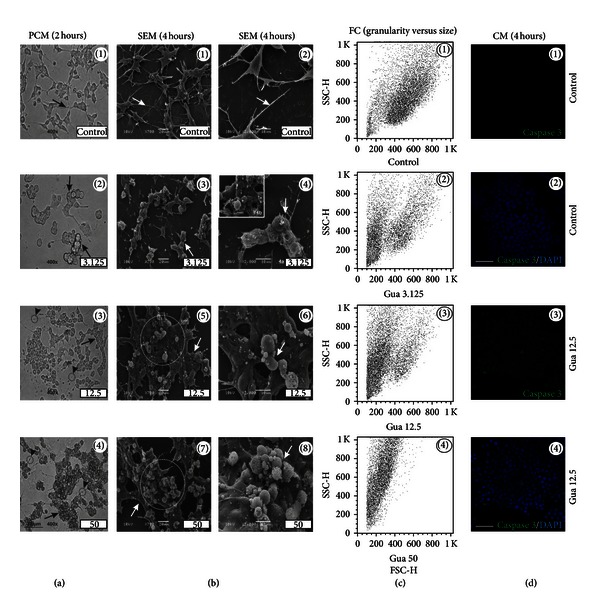
Figure 2.

Guarana-induced morphological alterations in human neuronal SH-SY5Y cells. (a) Phase contrast microscopy (PCM) of SH-SY5Y cells after treatments with different concentrations of guarana (3.125, 12.5, and 50 mg/mL) for 2 hours in FBS-free culture medium. Scale bar represents 30 μm. (b) Scanning electron microscopy (SEM) of SH-SY5Y cells after treatments with different concentrations of guarana (3.125, 12.5, and 50 mg/mL) for 4 hours in FBS-free culture medium. Scale bars represent 20 or 10 μm (for ×700 or ×2000, resp.). (c) Analysis of cellular complexity or granularity (side scatter, SSC-H) and size (forward scatter, FSC-H) by flow cytometry (FC), after treatment with different concentrations of guarana (3.125, 12.5, and 50 mg/mL) for 4 hours in FBS-free culture medium. (d) Confocal immunofluorescence microscopy (CM) of cleaved caspase-3 expression (green fluorescence) and DAPI (nuclei) on SH-SY5Y cells, after treatment with 12.5 mg/mL of guarana for 4 hours in FBS-free culture medium. Scale bars represent 10 μm.
