
Figure 7.
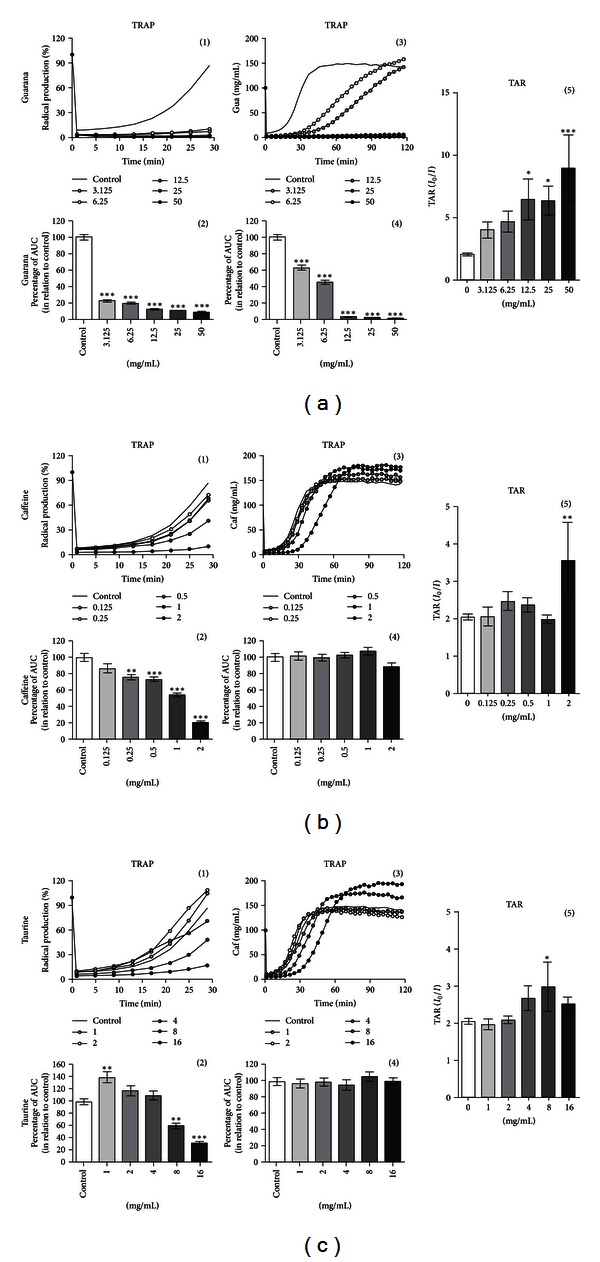
Total reactive antioxidant potential (TRAP) and total antioxidant reactivity (TAR) on human neuronal SH-SY5Y cells exposed to major components of EDs. TRAP and TAR measurements on guarana-treated cells (2 hours) at concentrations of 3.125, 6.25, 12.5, 25, and 50 mg/mL (a), caffeine-treated cells (2 hours) at concentrations of 0.125, 0.25, 0.5, 1, and 2 mg/mL (b), and taurine-treated cells (2 hours) at concentrations of 1, 2, 4, 8, and 16 mg/mL (c). TRAP is shown as a representative graphic of the area under the curve (AUC) for 2 hours, and TAR is calculated as the ratio of light in the absence of samples (I 0)/light intensity right after sample addition (I). Values are expressed as mean ± SEM of three independent experiments (n = 3). Statistical difference compared to control was determined by one-way ANOVA followed by Dunnett's multiple comparison test (*P < 0.05; **P < 0.01; ***P < 0.001).