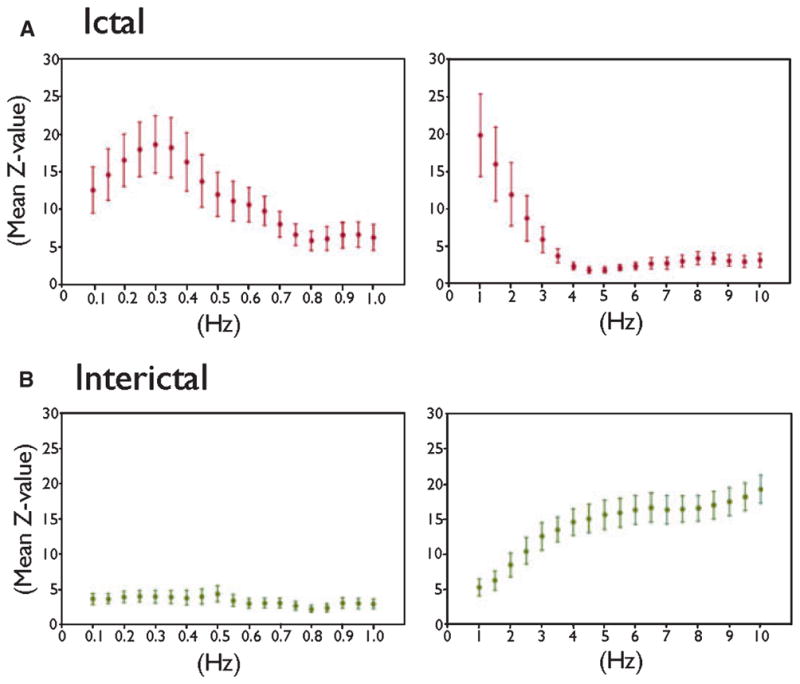
Figure 2.

Difference in cross-frequency coupling between ictal and interictal events. (A) Upper row. Ictal HFOs in the seizure-onset site were tightly coupled with the phase of slow-wave at ≤1 Hz. X-axis: frequency of phase of slow-oscillation. Y-axis: mean z-value on Ray-leigh’s test of nonuniformity with error bars. A larger z-value on Rayleigh’s test indicates a tighter cross-frequency coupling between the peak of HFOs and a given phase of slow-wave. The size of each time-frequency bin was “0.05 Hz and 1,000 ms” for frequencies between 0.1 and 1.0 Hz (graphs on the left side), while being “0.5-Hz and 100-ms” for frequencies between 1 and 10 Hz (graphs on the right side). (B) Lower row. Interictal HFOs in the seizure-onset site were only loosely coupled with the phases of slow-oscillations at ≤1 Hz but tightly coupled with those at ≥3 Hz.
Epilepsia © ILAE
