
Fig. 4.
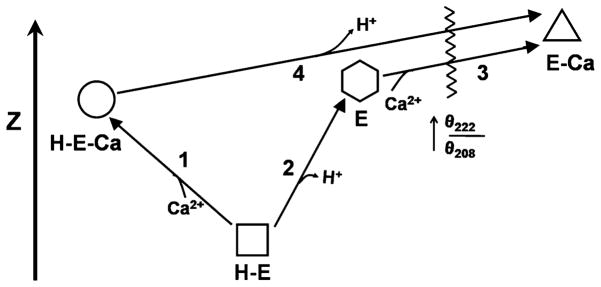
Schematic depicting the effects of Ca2+ and pH on the structure of PhK as defined through circular dichroism and zeta potential. The four conformers, two at pH 6.8 (H-E and H-E-Ca) and two at pH 8.2 (E and E-Ca), are vertically arranged according to the values of their zeta potential, with the Ca2+-free form at pH 6.8 having the most negative zeta potential and negligible catalytic activity. The numbers represent conformational transitions between forms, and the waved line intersecting conformational transitions 3 and 4 represents the occurrence of a greatly increased θ222/θ208 ratio. The Ca2+-bound conformer at pH 8.2 has by far the greatest catalytic activity. Copyright 2008 Wiley: used with permission from Liu, Weiya; Priddy, Timothy S.; Carlson, Gerald M., Physiochemical changes in phosphorylase kinase associated with its activation, Protein Science, John Wiley and Sons.