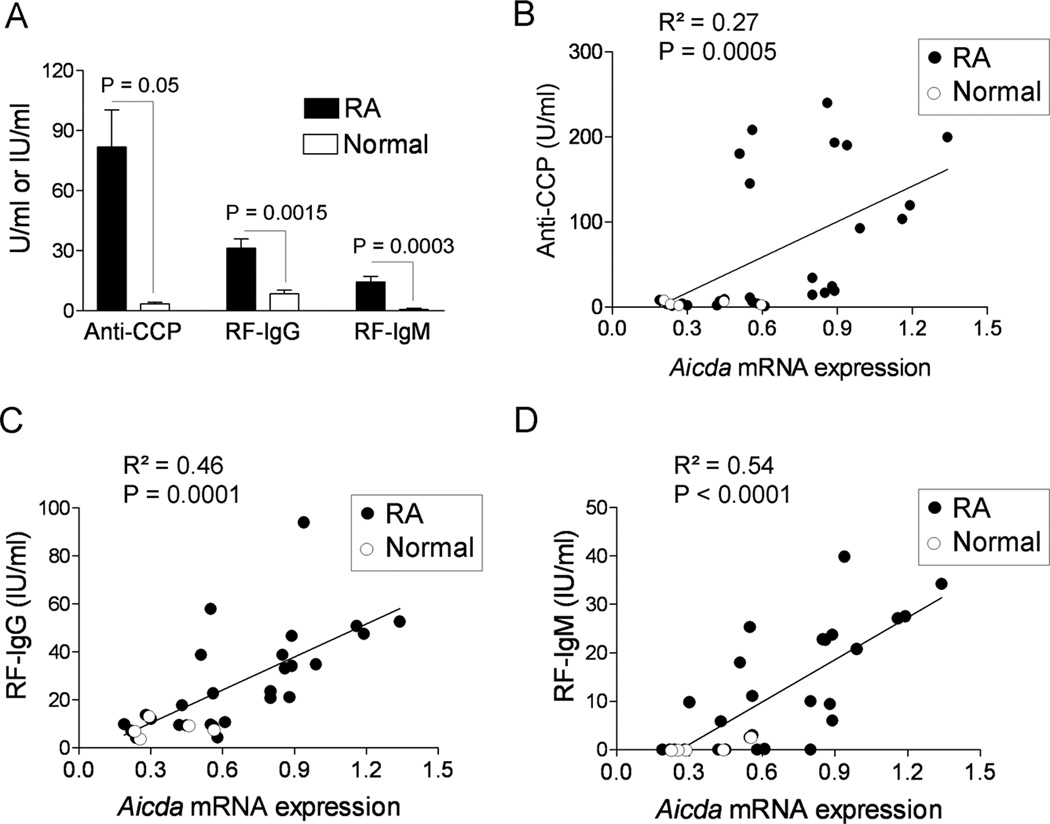
Figure 3. Correlation of Aicda with the levels of autoantibodies in the sera of patients with RA.
The levels of autoantibodies in the sera of patients with RA (N = 22) and normal individuals (N = 5) were analyzed using commercially available ELISA kits. (A) ELISA result for the expression of anti-CCP (U/ml), RF-IgM (IU/ml) and RF-IgG (IU/ml) in all 27 subjects recruited in this study. Relative Aicda mRNA expression in the PBMCs was correlated with the levels of autoantibody (B) Anti-CCP (C) RF-IgG and (D) RF-IgM in the sera of patients with RA (solid circles) and normal (open circles) individuals. The R2 and p values are shown in the figures.

