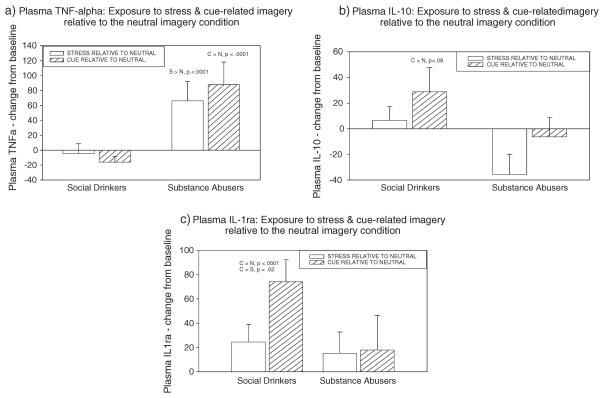
Figure 4.
Group differences between cocaine dependent individuals and social drinkers in (a) TNF alpha, (b) Interleukin-10, and (c) Interleukin-1 receptor antagonist following exposure to stress-related and cue-related imagery. Bars represent response in these conditions relative to the relaxing (control) imagery condition (means and standard errors shown). As no significant time-point interactions were observed, bars represent data collapsed across all time-points.

