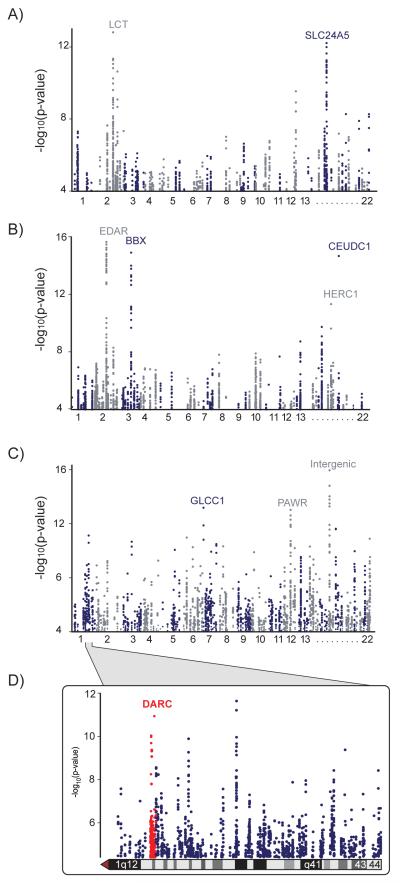
Figure 1. Genome-wide CMS.
CMSGW scores calculated from full genome sequence data from the 1000 Genomes Consortium in samples from (A) Northern Europe, (B) East Asia, and (C) West Africa. The y-axis represents the significance level (p-value on -log10 scale) for each of the variants tested across the genome, showing only variants with significance levels exceeding 10−4 (corresponding to 4 on the y-axis). See also Table S1.

