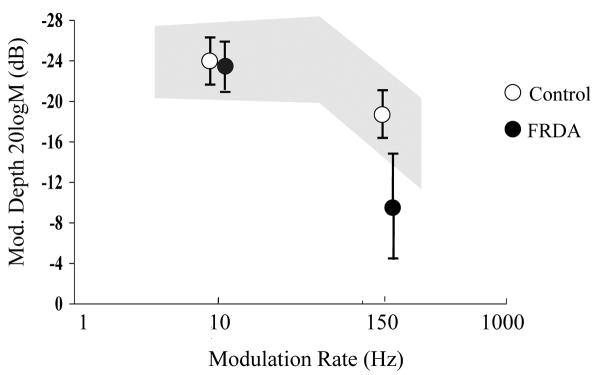
Figure 2.

AM detection thresholds for Friedreich ataxia and control subjects (mean ±1 SD). The shaded area represents the normal range for school-aged children from Rance and colleagues.13 Abbreviation: FRDA, Friedreich ataxia; Mod., modulation; SD, standard deviation.
