Fig. 4.
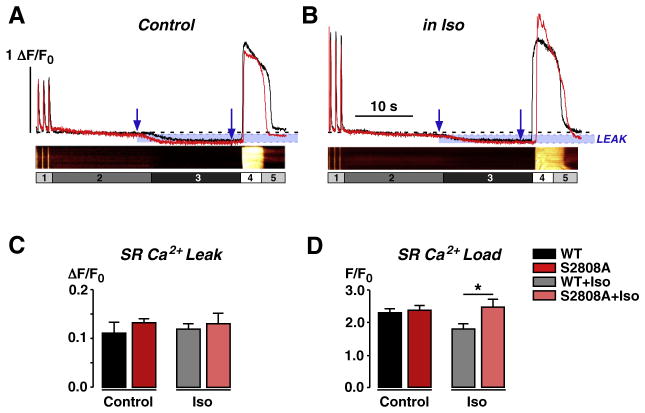
Comparison of sarcoplasmic reticulum (SR) Ca2+ leak at control and during β-adrenergic stimulation. A, B Fluo-3 AM-loaded cells were field-stimulated to steady-state Ca2+ transient amplitudes in control solution (label 1, 1.8 mmol/L Ca2+), then solution was rapidly switched to 0 Na+/0 Ca2+ containing solution (2) to minimize loss of cellular Ca2+ and to prevent external Ca2+ influx, thereby creating a closed system. Addition of tetracaine (1 mmol/L, 3) blocked RyR2-mediated SR Ca2+ leak, shown by a reduction in basal Ca2+ levels. Total SR Ca2+ content was assessed by caffeine application (10 mmol/L, 4) before return to control solution (5). Shown are representative line profiles of WT (black, with corresponding line-scan images) and S2808A (red) myocytes in control (A) and during β-adrenergic stimulation with Iso (1 μmol/L; B). Blue arrows indicate areas taken for measurement of SR Ca2+ leak. Leak is highlighted in blue. C, Statistical comparison of SR Ca2+ leak showed no difference. D, SR Ca2+ load was significantly higher in S2808A than in WT cells during β-adrenergic stimulation.

