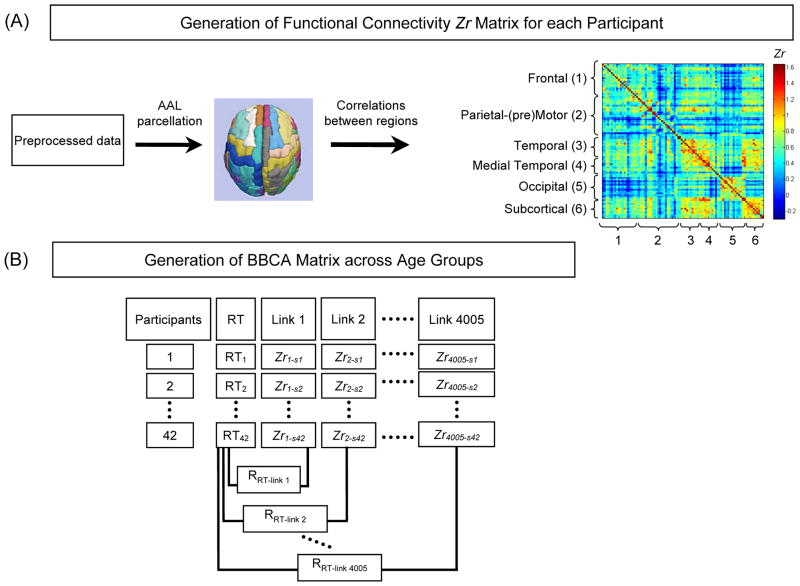
Figure 2.
Overview of the two major stages of the analysis of functional connectivity (FC). Panel A: First, for each participant, the preprocessed data were parceled into a set of 90 regions (45 within each left/right hemisphere) in the Automated Anatomical Labeling (AAL) Template (Tzourio-Mazoyer, et al., 2002). The individual regions are listed in Supplementary Table 1. A FC matrix for each participant was generated, with each cell containing the Fisher Zr-transformed correlation coefficient between each pair of brain regions. The regions were further categorized into six systems based on the Salvador et al. (2005) multidimensional scaling of resting-state data. Panel B: Second, we applied behavior-based connectivity analysis (BBCA) to correlate the connectivity strength of each link, from the matrix illustrated in Panel A, with averaged log-transformed reaction time (RT) across eight task conditions. The RRT-linki (i = the link number) represents the across-participant correlations between the regional Zr values and RT across age groups.

