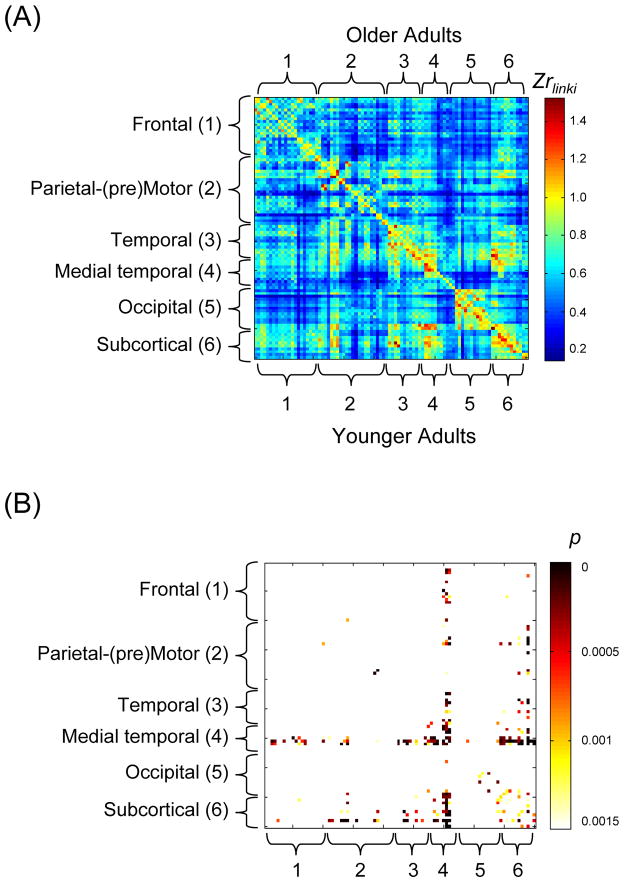
Figure 3.
Panel A: Averaged FC Zr matrix across participants within each age group, with the younger group below the diagonal and the older group above the diagonal. In this 90 × 90 square matrix, the x and y axes represent the 90 regions of the Automated Anatomical Labeling (AAL) Template (Tzourio-Mazoyer, et al., 2002), and each matrix element is colored to represent the FC (Zr value) between a pair of listed brain regions. The regions were further categorized into six systems based on the Salvador et al. (2005) multidimensional scaling of resting-state data. Panel B: Distribution of age group differences in connectivity strength. All age group differences were in the direction of younger > older. Each matrix element is colored to represent the p value of the younger > older effect (corrected for multiple comparisons at a false discovery rate of 0.05).

