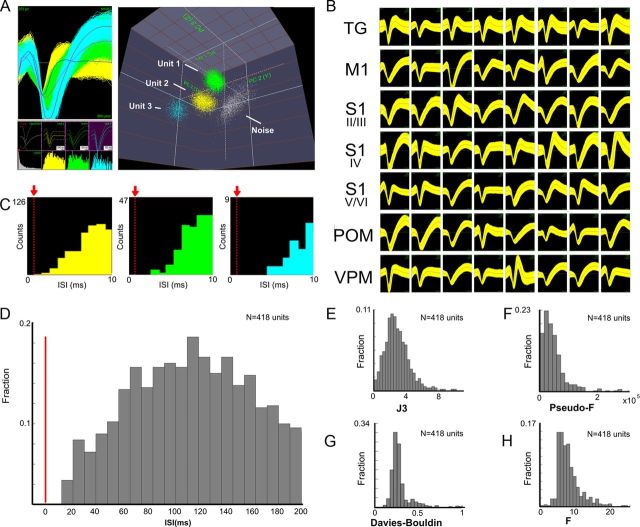
Figure 1.
Cluster separation and waveform quality in recordings. A, Typical examples of single unit waveforms and cluster separation (3D) recorded. B, Examples of waveforms from single units recorded in all regions studied. C, ISIs of Units 1–3 presented in A. The red arrows indicate the refractory period. Note the absence of spike counts in the refractory period. D, Distribution of average ISIs for single units recorded in all control sessions. E–H, Distributions of single unit statistics for all control sessions.

