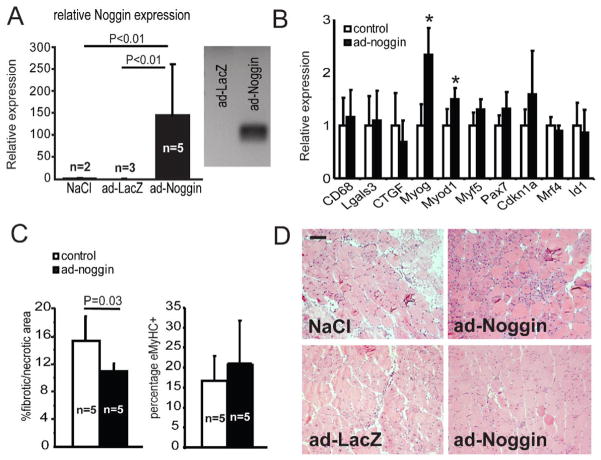
Fig. 5. Adenoviral-mediated overexpression of Noggin in dystrophic muscle.
(A) The left panel shows qRT-PCR analysis of control (n=5) and ad-Noggin (n=5) gastrocnemius cDNA with primers specific for human Noggin. The right panel shows a representative gel with RT-PCR product amplified with human Noggin specific primers. The amplified products of all ad-Noggin samples were isolated, sequenced and identified as human Noggin. (B) qRT-PCR analysis of myogenic, inflammation and fibrosis marker gene expression in gastrocnemius samples of control (n=5) and ad-Noggin (n=5). Error bars represents s.d. *P<0.01 (C) Quantitative analysis of fibrotic/necrotic areas as determined with H&E staining and the percentage of eMyHC+ fibers of control (n=5) and ad-Noggin (n=5) muscle sections. Error bars represents s.d. (D) Representative pictures of H&E stainings of control muscle (NaCl and LacZ) and contralateral ad-Noggin injected muscle. Scale bar = 100 μm

