
Figure 3.
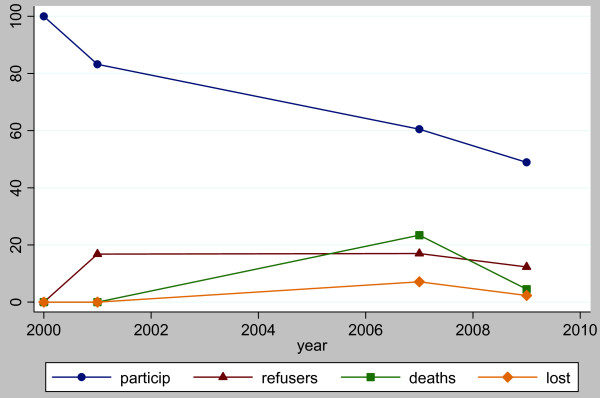
Longitudinal urban cohort ageing study participation, refusals, deaths and losses over the first nine years. particip: percentage of participants remaining from baseline (n = 3,326). refusers: percentage of persons who refused the current wave but had participated in the previous wave. deaths: percentage of persons who died between the previous and current wave. lost: percentage of persons who were lost to follow-up between the previous and current wave.