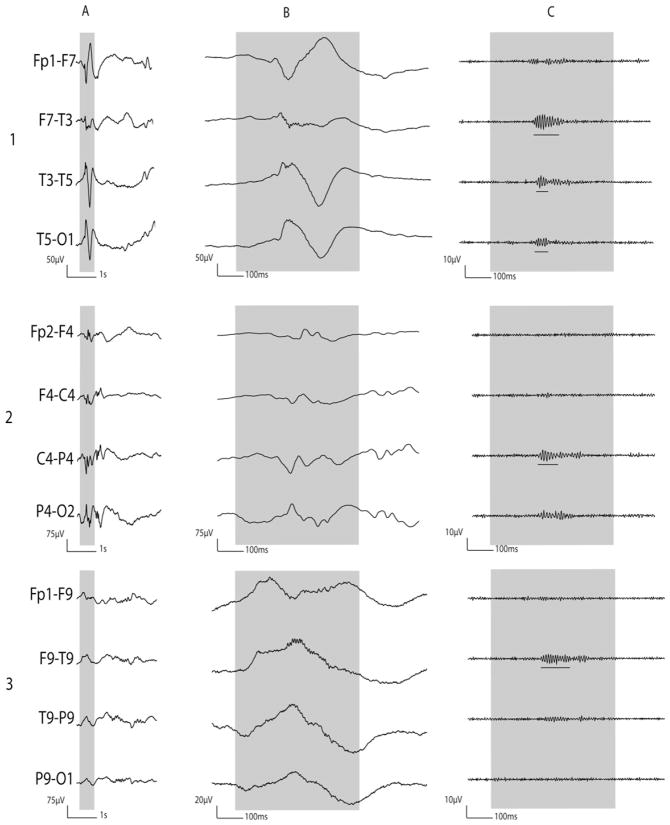
Fig. 5.
Ripples recorded with surface EEG. Example of ripples recorded on surface EEG. The upper section shows ripple oscillations co-occurring with a spike, with oscillations visible during the spike. The middle section shows a ripple co-occurring with a spike with oscillations not visible during the spike, but visible after filtering. In the bottom section a ripple independent of any spike can be observed. (A) Raw EEG. (B) Raw EEG with expanded time. (C) EEG filtered with high-pass filter of 80 Hz.
Source: Figure adapted from Andrade-Valenca et al. (2011b) with permission of the Lippincott Williams & Wilkins.

