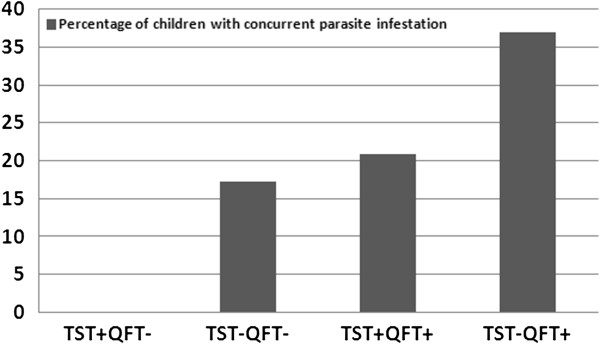
Figure 1.
Association between parasite infestation and TST and QFT-GIT response. The figure shows the study cohort segregated by their response in the TST and QFT-GIT tests and then analyzed for the percentage in each subgroup with a concurrent parasite infestation as identified by stool sampling. The X-axis indicates category of immunodiagnostic test results as (‘-’ = negative and ‘+’ = positive) and the Y-axis indicates the percentage of children with at least one confirmed parasite infection.

