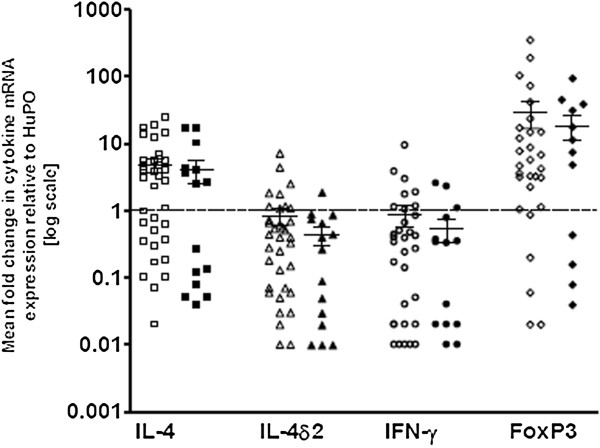
Figure 3.
Cytokine mRNA expression pattern among QFT-GIT-positive individuals, without (n = 36) and with concurrent parasitic infestation (n = 15). Data are from whole blood, showing mRNA levels, assessed by qRT-PCR, normalized and expressed relative to the housekeeping gene, human acidic ribosomal protein (HuPo). Empty dots indicate non-parasite infected and filled dots indicate parasite infected individuals. Each point represents the mean of duplicate experiments from a single individual and the median and interquartile values are shown by horizontal lines across the data points for each group.

