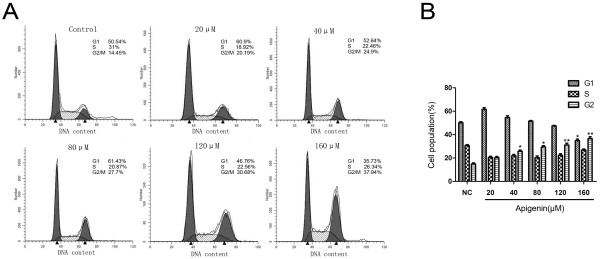
Figure 4.

Cell cycle analysis of T24 bladder cancer cells treated with apigenin. (A)Cells were treated with different concentrations of apigenin for 24 h and then stained with propidium iodide. The DNA content was analyzed by flow cytometry. G1, S, and G2/M indicate cell cycle phase. (B) It shows an obvious G2/M phase arrest with a concomitant decrease of cell number in G1 phase of the cell cycle. The percent of G2/M phase was quantified from three independent experiments. * P < 0.05, ** P < 0.01 versus untreated control.
