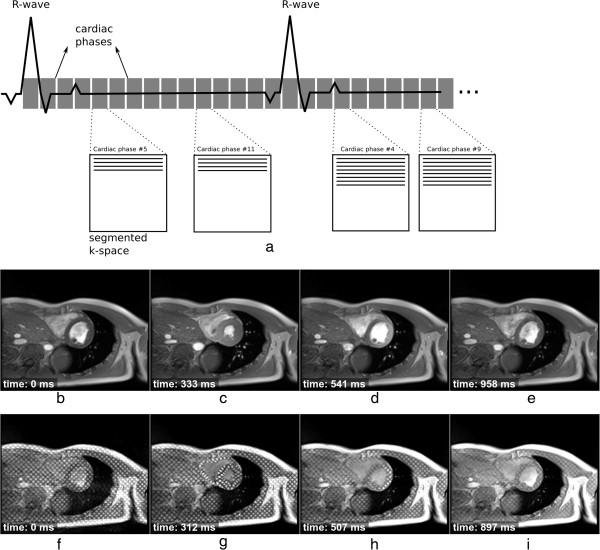
Figure 12.
Cine acquisition. a) Cine acquisition diagram showing 15 cardiac phases (cine frames). For each heart cycle in this example a segment with four phase-encode lines is acquired for each cine frame. K-space is being filled in a sequential manner. b-e) 4 frames out of 25 of a bSSFP short-axis cine showing the acquisition time after the R wave. f-i) 4 frames out of 25 of a GRE short-axis cine where a tagging pulse was applied immediately after each R-wave. The time of acquisition after the R wave is also shown.

