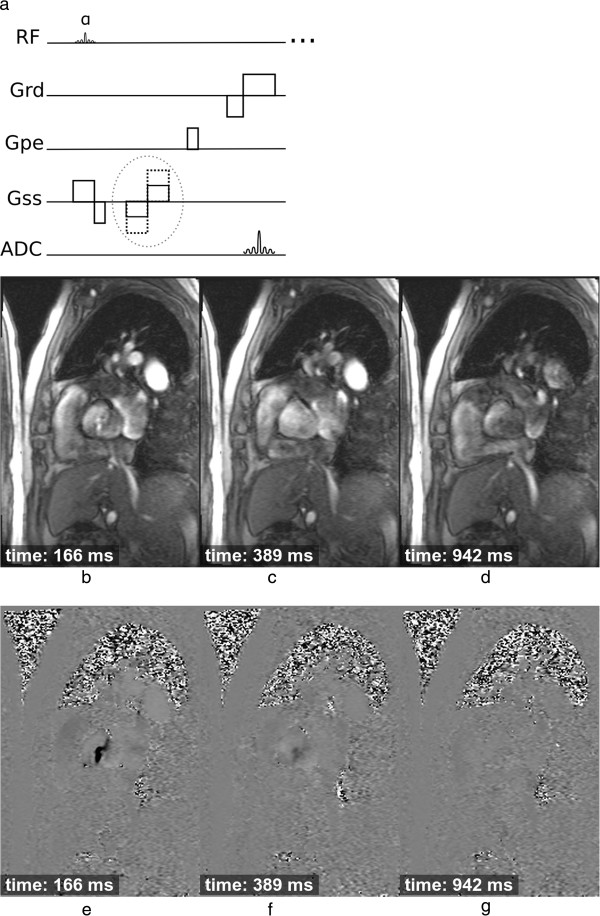
Figure 13.
Blood flow imaging. a) GRE sequence which is repeated with two different bipolar gradient moments (dashed circle). b-g) Cine frames showing through-plane blood flow of the aortic valve at three different time points of the heart cycle in a patient with valve stenosis: b-d) 3 of 20 magnitude cine frames showing the acquisition time after the R wave, e-g) the respective phase velocity frames.

