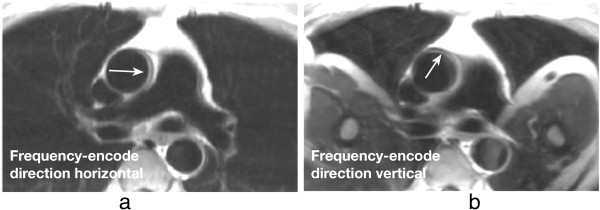
Figure 30.

TSE chemical shift artefacts. a-b) TSE image of a transverse plane through the great vessels above the heart, illustrating chemical shift artefacts between the aortic wall and surrounding fat: a) horizontal frequency-encode, b) vertical frequency-encode. Artefacts are visible in the aortic wall along the frequency-encode direction (arrows). This artefact can potentially be misdiagnosed as an aortic dissection in some cases. On image b with the frequency-encode direction swapped from a, wraparound artefacts of the patient’s arms into the chest are also visible.
